QT与MATLAB混合编程的详细教程
一天不学我浑身难受 人气:0QT与MATLAB混合编程
本文就介绍使用 Qt 和 Matlab 进行混合编程的基本流程,主要包括:
- 如何在Matlab中将m文件编译为C++语言的DLL文件
- 如何在Qt项目中加入自定义DLL相关的LIB文件,以及MATLAB相关的LIB文件和H文件搜索路径
- MATLAB运行时DLL文件所在路径,及系统相关的环境变量设置
- 如何在Qt中调用自定义DLL中的函数,如何通过mwArray类传递输入输出参数
一、环境
- Win10
- Qt 5.14.2 (MSVC 2017, 32 bit)
- matlab R2016b
- vs2017
二、将matlab程序写成函数形式
在MATLAB中编写一个画有向图的函数Matlab_Digraph.m为例,其代码如下:
function Matlab_Digraph(fullLineS,fullLineT,v,dottedLineS,dottedLineT,taskNum,jobId,oper,iCriticalPathS,iCriticalPathT,select)
close all;
figure('NumberTitle', 'off','Name', '有向图');
nodenames=cell(1,taskNum+2);
for i=1:taskNum+2
    if i==1
    nodenames{1,i}='开始';
    elseif i==taskNum+2
    nodenames{1,i}='结束';
    else
    txt = sprintf('J%d.%d(%d)',jobId(i-1),oper(i-1),v(i-1));
    nodenames{1,i}=txt;
    end
end
G= digraph(fullLineS,fullLineT,[],nodenames);
p=plot(G,'Layout','force');
p.ArrowSize=15;                                        %箭头大小
p.LineWidth=2;                                         %线宽
p.EdgeColor ='black';                                  %线颜色
p.Marker = 'o';                                        %节点标记符号
p.MarkerSize=10;                                       %节点大小
p.NodeColor = 'cyan';                                  %节点颜色
set( gca,'XTick' ,[] ,'YTick',[]);
highlight(p,dottedLineS,dottedLineT,'LineStyle','--') ;
if select==1
    highlight(p,iCriticalPathS,iCriticalPathT,'EdgeColor','r','LineWidth',5) ;
end
end
在matlab中运行一下,如:
% 函数digraph(s,t,v):可在 s 和 t 中的对应节点之间创建边,并生成一个图
% s 和 t 都必须具有相同的元素数;这些节点必须都是从1开始的正整数,或都是字符串元胞数组。
>> fullLineS=[1  1  5  1  3  8  7  2  6  9  4  10  2  3  5  6  8  9];
>> fullLineT= [2  3  4  5  6  7  11  8  9  11  10  11  3  4  6  7  9  10 ];
>> v=[3 2 4 3 3 3 3 5 3];
>> dottedLineS=[1 2 3];             %虚线
>> dottedLineT=[2 3 4];
>> taskNum=9;
>> jobId=[ 2 1 3 3 1 2 2 1 3 ];
>> oper=[ 1 1 2 1 2 3 2 3 3 ];
>> iCriticalPathS=[5 8];            %关键路径
>> iCriticalPathT=[6 9];
>> select=1;
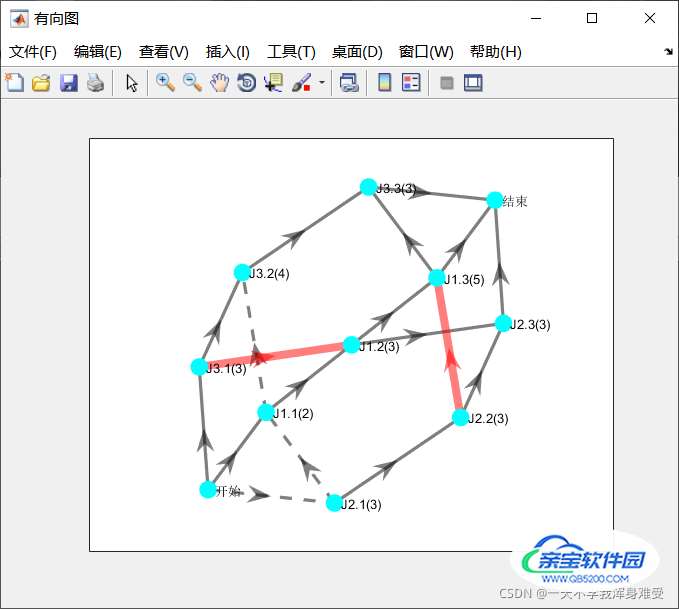
同时绘图如下:
三、将函数的.m文件转换成动态链接库形式
首先,检查一下自己的mcc编译器是否可用
命令行输入指令
>> !mcc
正常的结果应该如下:
mcc Compile MATLAB functions for deployment outside MATLAB.
mcc [-options] fun [fun2...]
OPTIONS:
a <filename> Add <filename> to the deployable archive. If the specified
file is an m, mex or p file, this function will not be exported in the
resulting target.
C Generate a separate deployable archive.
d <directory> Output directory.
e Suppress MS-DOS Command Window. Use in place of -m.
g Include debugging symbol information.
I <path> Add <path> to the list of paths to search for files.
m Generate a standalone application.
N Clear the compilation search path of all directories except the following
core directories:
<matlabroot>/toolbox/matlab
<matlabroot>/toolbox/local
<matlabroot>/toolbox/compiler
o <outputfilename> Output name.
p <directory> Add <directory> to the compilation search path. This
option can only be used in conjunction with the -N option.
R <option> Specify the run-time options for the MATLAB Runtime.
v Verbose.
Y <license.dat file> Override the default license.dat file.
EXAMPLES:
Make a standalone executable for myfun.m:
mcc -m myfun
Make standalone executable for myfun.m. Look for myfun.m in the
directory /files/source, and put the resulting C files and executable in
the directory /files/target:
mcc -m -I /files/source -d /files/target myfun
Make a standalone executable from myfun1.m and myfun2.m:
mcc -m myfun1 myfun2
For more details, execute "doc mcc" from MATLAB.
如果出现error,那么就是Matlab的编译器不能用,原因是Matlab并未完全破解。
解决了编译器问题之后,之后输入mbuild -setup
>> mbuild -setup
MBUILD 配置为使用 'Microsoft Visual C++ 2017 (C)' 以进行 C 语言编译。

要选择不同的语言,请从以下选项中选择一种命令:
 mex -setup C++ -client MBUILD
 mex -setup FORTRAN -client MBUILD
要使用C++编译器,所以要点击上面的mex -setup C++ -client MBUILD
之后,在命令行输入
>> mex -setup
>> mex -setup
MEX 配置为使用 'Microsoft Visual C++ 2017 (C)' 以进行 C 语言编译。
警告: MATLAB C 和 Fortran API 已更改,现可支持
	包含 2^32-1 个以上元素的 MATLAB 变量。不久以后,
	 您需要更新代码以利用
	 新的 API。您可以在以下网址找到相关详细信息:
	 http://www.mathworks.com/help/matlab/matlab_external/upgrading-mex-files-to-use-64-bit-api.html。

要选择不同的语言,请从以下选项中选择一种命令:
 mex -setup C++
 mex -setup FORTRAN
然后选择:mex -setup C++
需要注意的是,matlab每次重启后,都要重新按以上步骤进行mbuild -setup/mex -setup的配置。
选择Liberty Complier

“TYPE”部分选择C++ shared Library,“EXPORTED FUNCTIONS”是需要导出的m文件,点击右侧的“Add”按钮选择编写的文件Matlab_Digraph.m。右侧是MATLAB运行时库的安装打包方式,在本机上测试可选择“Runtime downloaded from web”。
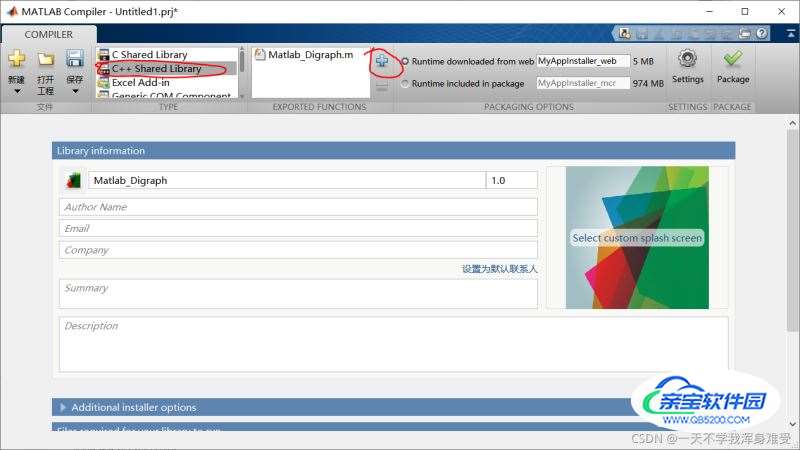
打包完成后,在项目文件Matlab_Digraph.prj的目录下生成与项目同名的子目录,即\Matlab_Digraph,该目录下有3个文件夹。
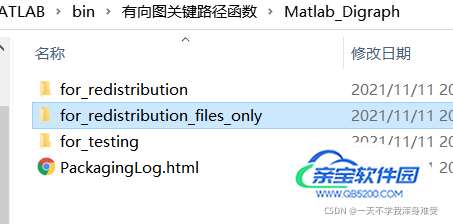
Matlab_Digraph\for_redistribution_files_only目录下是编译生成的.dll 、.lib和.h文件,其中.lib和.h文件是在Qt项目编译时需要用到的,.dll文件是程序运行时需要用到的。
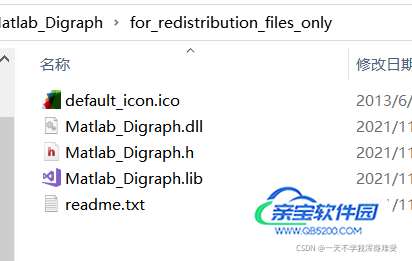
将生成的.h.lib.dll文件三个一起拷到代码所在的文件夹。
可以使用Dependency Walker来查看.dll文件中的一些内容

四、QT调用
1.添加外部库
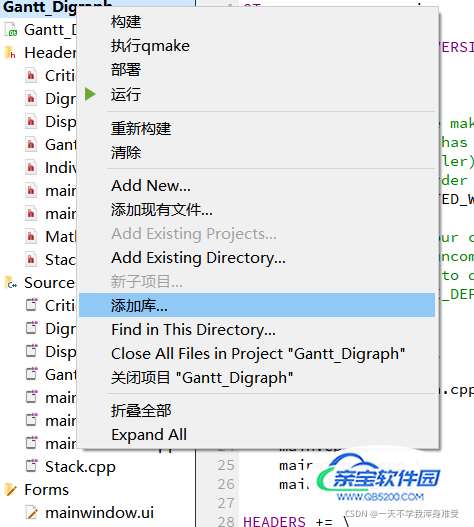

点击下一步,之后按如下配置,点击浏览选择库,之后勾掉Linux和Mac,且勾掉为debug版本添加’d’作为后缀。
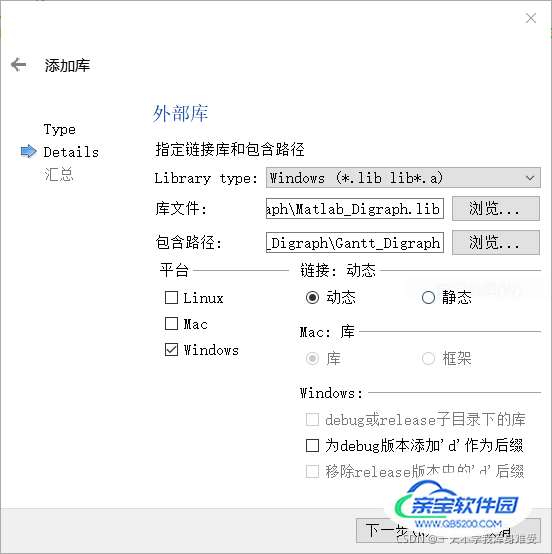
点击下一步,你就会发现你的.pro文件中多了几行:
win32: LIBS += -L$$PWD/./ -lMatlab_Digraph

INCLUDEPATH += $$PWD/.
DEPENDPATH += $$PWD/.
2.Matlab其他依赖库和头文件搜索路径的加入
重点是Qt 的pro文件的配置,我们需要在pro文件中加入以下内容:
DEFINES += __MW_STDINT_H__

INCLUDEPATH += D:/MATLAB/extern/include
INCLUDEPATH += D:/MATLAB/extern/include/win64

LIBS += -LD:/MATLAB/extern/lib/win64/microsoft -llibmx
LIBS += -LD:/MATLAB/extern/lib/win64/microsoft -llibmat
LIBS += -LD:/MATLAB/extern/lib/win64/microsoft -lmclmcr
LIBS += -LD:/MATLAB/extern/lib/win64/microsoft -lmclmcrrt
LIBS += -LD:/MATLAB/extern/lib/win64/microsoft -llibeng
(这个要根据自己的Matlab具体的安装位置来修改。)
3.工程中的头文件中添加.h文件
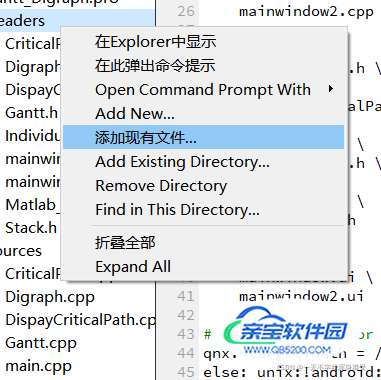
#include "Matlab_Digraph.h"
4.系统环境变量的设置
额外加入的一些库实际上对应于MATLAB运行时的一些DLL文件,这些运行时文件主要在以下几个目录下,所以要保证这些目录添加到了Windows的环境变量PATH里。
D:\MATLAB\runtime\win64;
D:\MATLAB\\bin\win64;
若是程序发布到没有安装MATLAB的电脑上,需要用Matlab Compiler编译生成的安装包。
5 编写使用DLL内函数的代码
(1)DLL的初始化
Matlab_DigraphInitialize();
在使用Matlab_Digraph.dll里的函数之前,必须先初始化。Matlab_DigraphInitialize()是库初始化函数。
(2)函数的输入输出参数
mwArray是MATLAB的数组类,MATLAB编译生成的DLL的接口函数的参数都是采用mwArray类型,例如Matlab_Digraph.h文件中的函数Matlab_Digraph()的函数原型为:
extern LIB_Matlab_Digraph_CPP_API void MW_CALL_CONV Matlab_Digraph(const mwArray& fullLineS, const mwArray& fullLineT, const mwArray& v, const mwArray& dottedLineS, const mwArray& dottedLineT, const mwArray& taskNum, const mwArray& jobId, const mwArray& oper, const mwArray& iCriticalPathS, const mwArray& iCriticalPathT, const mwArray& select);
6 mwArray类的使用
四、编译和运行
void DiGraph::DrawDigraph_CP()
{
	select[0] = 1;
	VectorToArr();
	DrawLines();
	TransFormat();
	c.ImportData_Digraph(in_degree, in_out_weight, MAXVEX, MAXEDGE);
	criticalPathArcSize = c.TransferResults_CP(&iCriticalPathS, &iCriticalPathT);
	if (!Matlab_DigraphInitialize())           // 初始化,必须要使用
	{
		qDebug() << "add init failed.";
		return;
	}
	mwArray in_fullLineS(1, MAXEDGE, mxDOUBLE_CLASS, mxREAL);
	mwArray in_fullLineT(1, MAXEDGE, mxDOUBLE_CLASS, mxREAL);
	mwArray in_jobId(1, taskNum[0], mxDOUBLE_CLASS, mxREAL);
	mwArray in_oper(1, taskNum[0], mxDOUBLE_CLASS, mxREAL);
	mwArray in_v(1, taskNum[0], mxDOUBLE_CLASS, mxREAL);
	mwArray in_dottedLineS(1, MAXEDGE - workPieceNum - taskNum[0], mxDOUBLE_CLASS, mxREAL);
	mwArray in_dottedLineT(1, MAXEDGE - workPieceNum - taskNum[0], mxDOUBLE_CLASS, mxREAL);
	mwArray in_taskNum(1, 1, mxDOUBLE_CLASS, mxREAL);
	mwArray in_iCriticalPathS(1, criticalPathArcSize, mxDOUBLE_CLASS, mxREAL);
	mwArray in_iCriticalPathT(1, criticalPathArcSize, mxDOUBLE_CLASS, mxREAL);
	mwArray in_select(1, 1, mxDOUBLE_CLASS, mxREAL);

	in_fullLineS.SetData(fullLineS, MAXEDGE);
	in_fullLineT.SetData(fullLineT, MAXEDGE);
	in_jobId.SetData(jobId, taskNum[0]);
	in_oper.SetData(oper, taskNum[0]);
	in_v.SetData(macDurationTime, taskNum[0]);
	in_dottedLineS.SetData(dottedLineS, MAXEDGE - workPieceNum - taskNum[0]);
	in_dottedLineT.SetData(dottedLineT, MAXEDGE - workPieceNum - taskNum[0]);
	in_taskNum.SetData(taskNum, 1);
	in_iCriticalPathS.SetData(iCriticalPathS, criticalPathArcSize);
	in_iCriticalPathT.SetData(iCriticalPathT, criticalPathArcSize);
	in_select.SetData(select, 1);

	Matlab_Digraph(in_fullLineS, in_fullLineT, in_v, in_dottedLineS, in_dottedLineT, in_taskNum, in_jobId, in_oper, in_iCriticalPathS, in_iCriticalPathT, in_select);
}
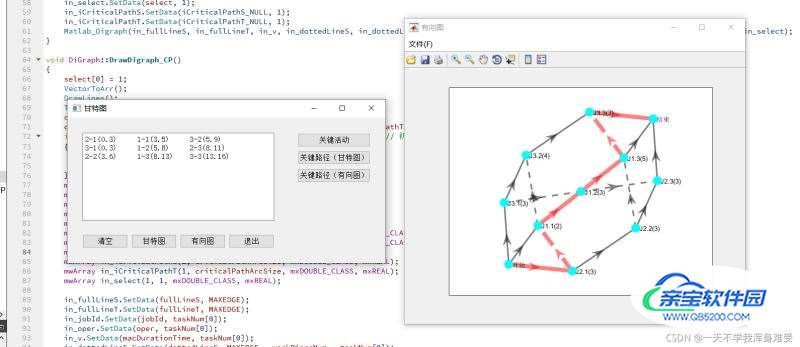
然后构建项目运行,弹出plot绘图,与预期相符
总结
加载全部内容