Vue图标插件之柱状图
生活从程序开始 人气:3Echart是一个很好的图表绘制插件,里面有各种各样的图表供我们选择,最近用echart做图表比较多,所以现在记录一下用到的柱状图用到的一些配置和用法:
主要注意的点:
1、创建的画布必须给定大小,不然无法显示
2、xAxis中的data默认为空时,X轴的的描述不存在,xAxis中axisLabel的interval的值表示隔几列显示,默认为1
3、Series就是图表的数据中心,data是传入的数据,可以通过barMaxWidth设置柱子的宽度
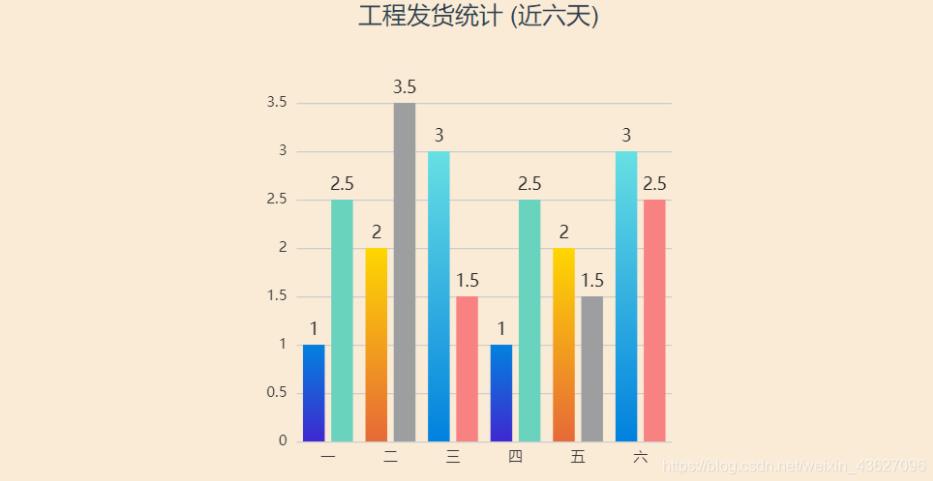
4、重点是柱子的颜色Series中itemStyle的color就是用来设置柱子的颜色的,如果柱子要使用不同的颜色那么需要先自定义一个数组来存放颜色字符串,然后通过遍历的方法进行颜色的渲染
好了,废话不多说直接上代码,代码的注释很详细,应该能看得懂。
<template>
  <div class="count-chart-wrapper">
    <div class="chart-title">
      工程发货统计
      <span>(近六天)</span>
    </div>
    <div class="count-chart" ref="chart"></div><!--必须设置宽高-->
  </div>
</template>

<script>
import echarts from "echarts";

export default {
  data() {
    return {
      colorList: [
        //设置发货柱子的,普通的柱子颜色
        "#69D3BE",
        "#9D9E9F",
        "#F88282"
      ],
      colorList2: [
        //设置发货柱子的,柱子实现渐变色
        ["#0282DE", "#3F28D0"],
        ["#FED701", "#E66938"],
        ["#67E0E3", "#0181DE"]
      ]
    };
  },
  mounted() {
    this.initChart();
  },
  methods: {
    // 初始化图表样式
    initChart() {
      this.chart = echarts.init(this.$refs.chart);
      let _this = this;
      this.chart.setOption({
        grid: {
          left: "50"
          // right: "60"
        },
        legend: {
          show: false,
          data: this.legends
        },
        tooltip: {
          trigger: "axis",
          show: true,
          axisPointer: {
            // 坐标轴指示器,坐标轴触发有效
            type: "shadow" // 默认为直线,可选为:'line' | 'shadow'
          }
        },
        xAxis: {
          axisLine: { show: false }, // 轴线
          axisTick: { show: false }, // 刻度
          type: "category",
          data: ["一", "二", "三", "四", "五", "六"],//X轴显示
          axisLabel: {
            color: "#333",
            interval: 0 //0:不隔行显示,1:隔一行显示
          }
        },
        yAxis: {
          type: "value",
          nameTextStyle: {
            fontWeight: "bold",
            align: "left",
            padding: [0, 50, 10, 0],
            color: "#ffffff"
          },
          axisLine: { show: false }, // 轴线
          axisTick: { show: false }, // 刻度
          axisLabel: {
            color: "#333",
            formatter: `{value}`//Y轴的显示形式,value,percent
          }
        },
        series: [
          {//实现渐变色的柱子
            data: ["1", "2", "3", "1", "2", "3"],//显示的数据
            type: "bar",
            smooth: true, // 平滑
            symbol: "none",
            lineStyle: {
              color: "#FF5858"
            },
            barMaxWidth: 30,//设置柱子的宽度
            itemStyle: {
              normal: {
                label: {
                  show: true, //开启显示
                  position: "top", //在上方显示
                  textStyle: {
                    //数值样式
                    color: "#222",
                    fontSize: 14
                  }
                },
                color: params => {
                  let colorList = _this.colorList2;//实现柱子的渐变色数组
                  let index = params.dataIndex;//dataIndex  data中数据的下标
                  if (params.dataIndex >= colorList.length) {
                    index = params.dataIndex - colorList.length;
                  }
                  return new echarts.graphic.LinearGradient(0, 0, 0, 1, [ //渐变色使用方法
                    { offset: 0, color: colorList[index][0] },
                    { offset: 1, color: colorList[index][1] }
                  ]);
                }
              }
            }
          },
          {//实现普通色的柱子
            data: ["2.5", "3.5", "1.5", "2.5", "1.5", "2.5"],
            type: "bar",
            smooth: true, // 平滑
            symbol: "none",
            lineStyle: {
              color: "#FF5858"
            },
            barMaxWidth: 30,
            itemStyle: {
              normal: {
                label: {
                  show: true, //开启显示
                  position: "top", //在上方显示
                  textStyle: {
                    //数值样式
                    color: "#222",
                    fontSize: 14
                  }
                },
                color: params => {
                  let colorList = _this.colorList;//柱子的颜色是普通的颜色
                  let index = params.dataIndex;
                  if (params.dataIndex >= colorList.length) {
                    index = params.dataIndex - colorList.length;
                  }
                  return colorList[index];
                }
              }
            }
          }
        ]
      });
    }
  }
};
</script>

<style>
.count-chart-wrapper {
  width: 800px;
  margin: 0 auto;
  background-color: antiquewhite;
}
.count-chart {
  position: relative;
  margin: 0 auto;
  width: 400px;
  height: 400px;
}
</style>
结果图样:

加载全部内容