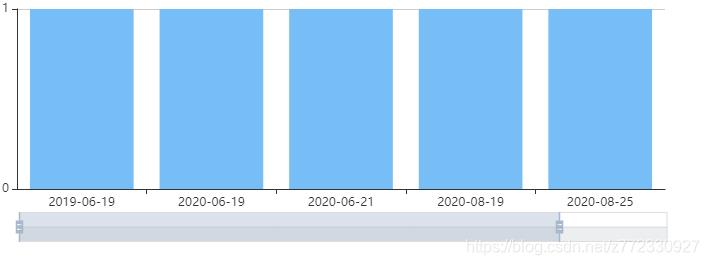
Vue Echarts带滚动效果柱形图
今天代码敲了吗 人气:0代码
<template>
  <div class="timeLineview">
    <div v-bind:style="{ height: heightData + 'px' }" ref="categoryChart"></div>
    <div v-bind:style="{ height: noHeight + 'px' }" class="nomore">
      {{ noData }}
    </div>
  </div>
</template>

<script>
import echarts from "echarts";
export default {
  components: {},
  name: "timeLine",
  props: {
    question: {}
  },
  data() {
    return {
      datainfo: [],
      datatitle: [],
      chart: null,
      heightData: 300,
      noHeight: 0,
      noData: ""
    };
  },
  methods: {
    resize() {
      this.chart.resize();
    },
    find() {
    //获取数据
      if (this.question) {
        for (let index = 0; index < this.question.length; index++) {
          if (this.question[index].statValue > 0) {
          //y轴
            this.datainfo.push(this.question[index].statValue);
            //X轴
            this.datatitle.push(this.question[index].statLabel);
          }
        }
      }

      this.chart = echarts.init(this.$refs.categoryChart);
      const option = {
        tooltip: {
          trigger: "axis",
          axisPointer: {
            type: "shadow"
          }
        },
        title: {},
        legend: {},
        dataZoom: [
          {
            type: "slider",
            start: 0,
            end: (100 / this.datainfo.length) * 5   //显示五个
          },
          {
            type: "inside",
            start: 0,
            end: (100 / this.datainfo.length) * 5//显示五个
          }
        ],
        xAxis: {
          data: this.datatitle
        },
        yAxis: { minInterval: 1 },   //显示为整数 最小间距1
        series: [
          {
            type: "bar",
            name: "数量",
            data: this.datainfo,

            itemStyle: {
              color: "#77bef7"
            }
          }
        ]
      };
      this.chart.setOption(option);
      if (this.datainfo.length > 0) {
        this.heightData = 300;
      } else {
        this.heightData = 0;
        this.noHeight = 300;
        this.noData = "暂无数据";
      }
    }
  },
  mounted() {
    this.find();
  },
  created() {}
};
</script>

<style  lang="less" scoped>
.nomore {
  display: flex;
  justify-content: center;
  align-items: center;
  font-size: 18px;
}
</style>
效果图

加载全部内容