java查询近七日数据功能的实现
超级帅帅吴 人气:0前文
在开写之前 先来看实现的思路
1.编写SQL 根据这七天的日期作为条件查询数据库
2.获取Java内每次从今天开始到前六天的日期数据
3.将查询出来数据做逻辑处理 之后返回json字符串
4.前端使用ajax对接接口 将获取的数据对接到echarts表图上面
注意 如果你只是看如何获取近七天的数据只看 1 2 3即可
编写SQL 根据这七天的日期作为条件查询数据库
说了实现思路 那么现在看一眼我的表结构是什么样子的
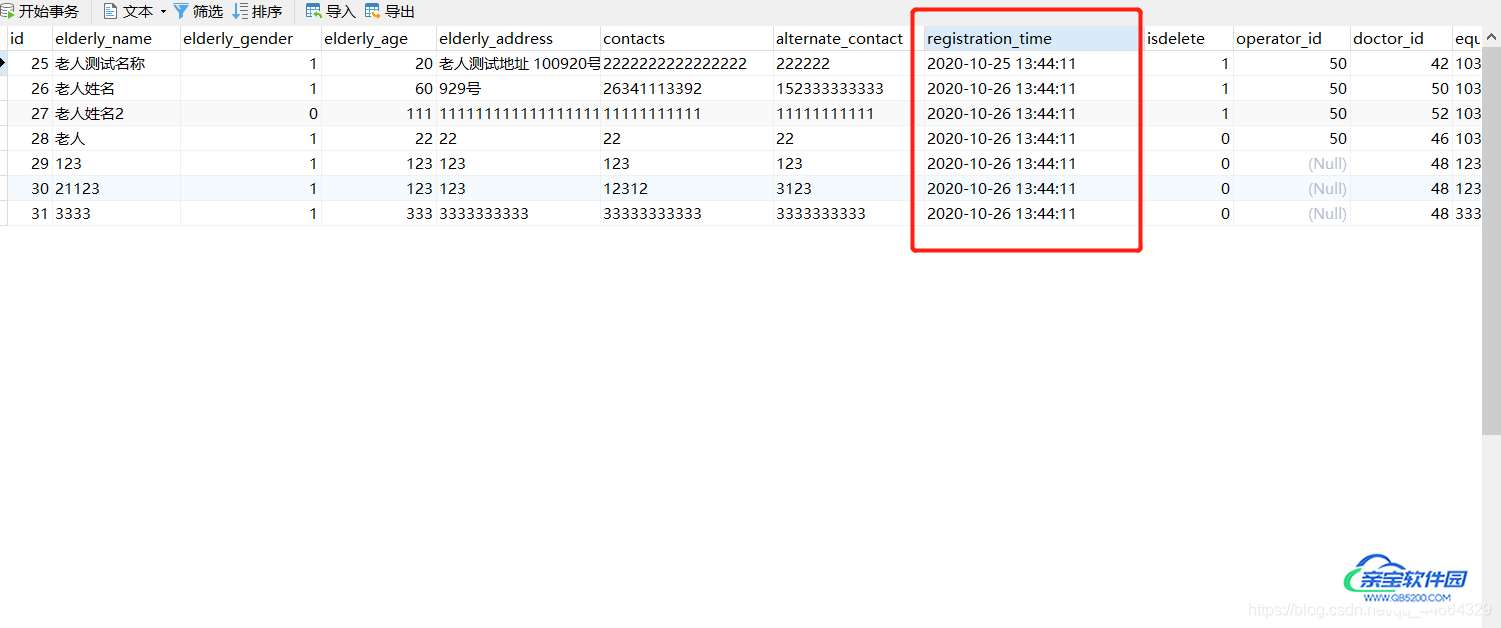
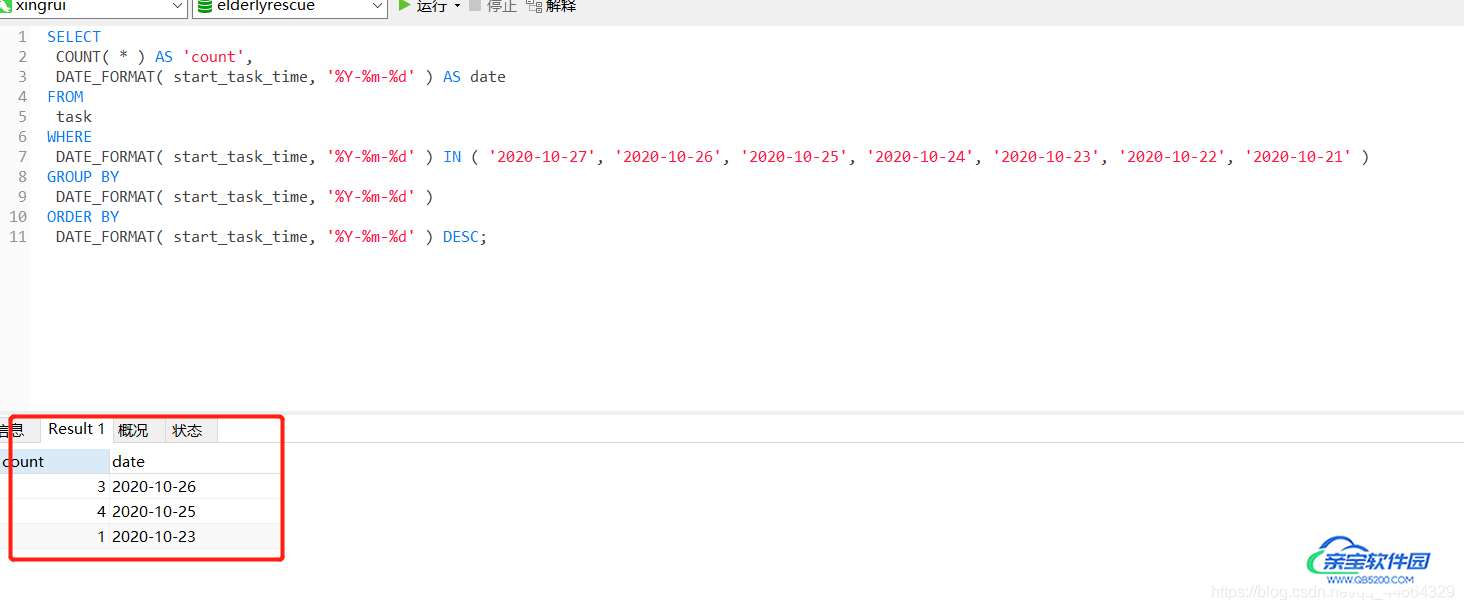
这里看到一共是7条数据 一共是 3条26号 4条25号 1条23号的数据
那么我们查询出来 按每日查询 有数据的显示几条数量
上SQL
SELECT
 COUNT( * ) AS 'count',
 DATE_FORMAT( start_task_time, '%Y-%m-%d' ) AS date
FROM
 task
WHERE
 DATE_FORMAT( start_task_time, '%Y-%m-%d' ) IN ( '2020-10-27', '2020-10-26', '2020-10-25', '2020-10-24', '2020-10-23', '2020-10-22', '2020-10-21' )
GROUP BY
 DATE_FORMAT( start_task_time, '%Y-%m-%d' )
ORDER BY
 DATE_FORMAT( start_task_time, '%Y-%m-%d' ) DESC;
查询出来的效果图
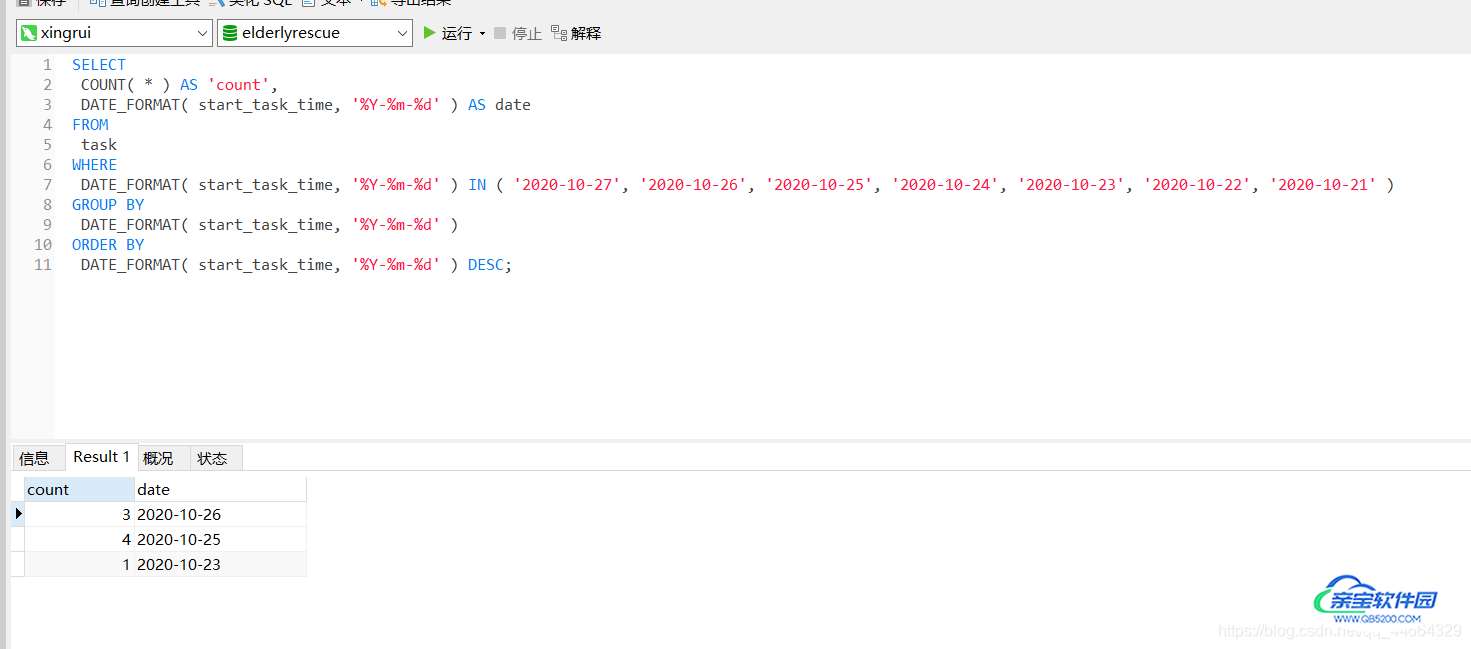
那么现在先来讲解一下sql 我是数据库里面时间是带了时分秒 而查询的条件日期是不带时分秒的 这句话的意思是日期格式转换 转换成年月日 去掉时分秒
DATE_FORMAT( start_task_time, '%Y-%m-%d' )
中间的这个是要查询的字段


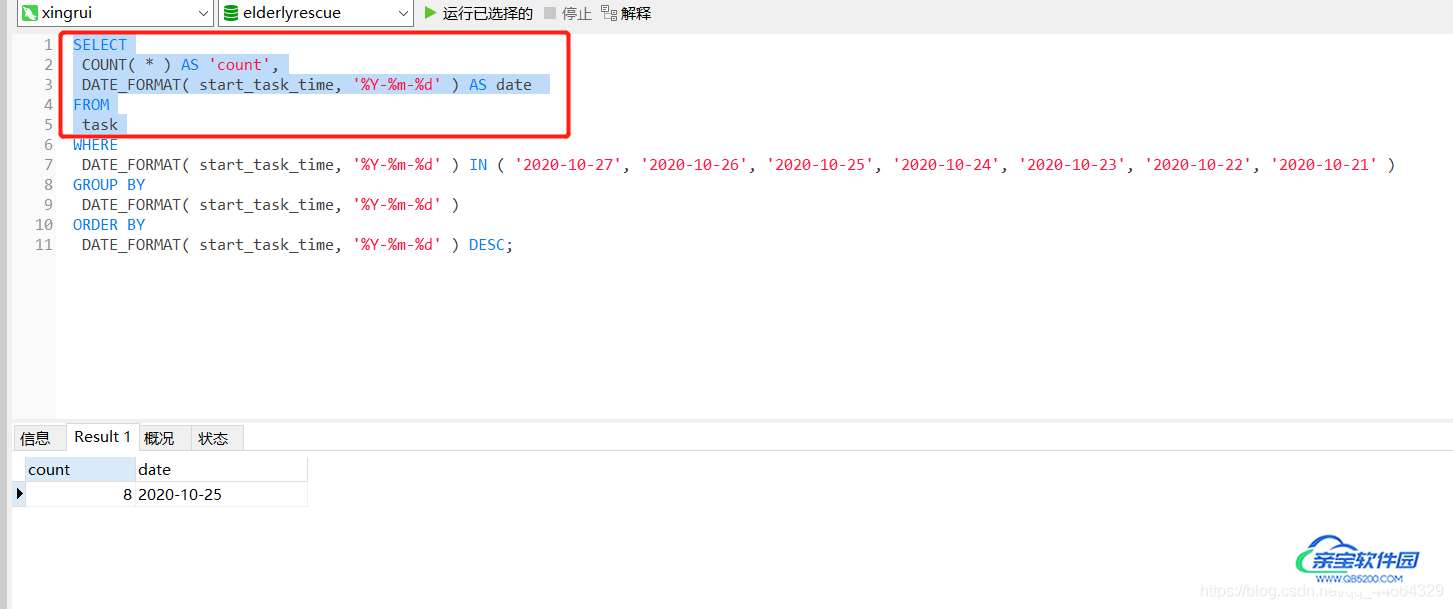
现在把SQL拆开来看 先看第一部分
sql的第一部分很好理解 第一个是查询出整表共有几条数据 ,第二个是查询出时间 AS的意思是字段取别名 。
现在查询出来的数据是 整表共8条数据 第一条的数据的时间是2020-10-25日
现在来看SQL的第二段
where DATE_FORMAT( start_task_time, ‘%Y-%m-%d’ ) 是要查询的条件我们根据日期条件进行查询 由于是一次查询七天的 所以需要使用 IN 一个字段多个条件。
后面的group by 分组 每一个日期条件查询出来的时间 进行分组 并显示共有几条 。
最后一个order by 排序
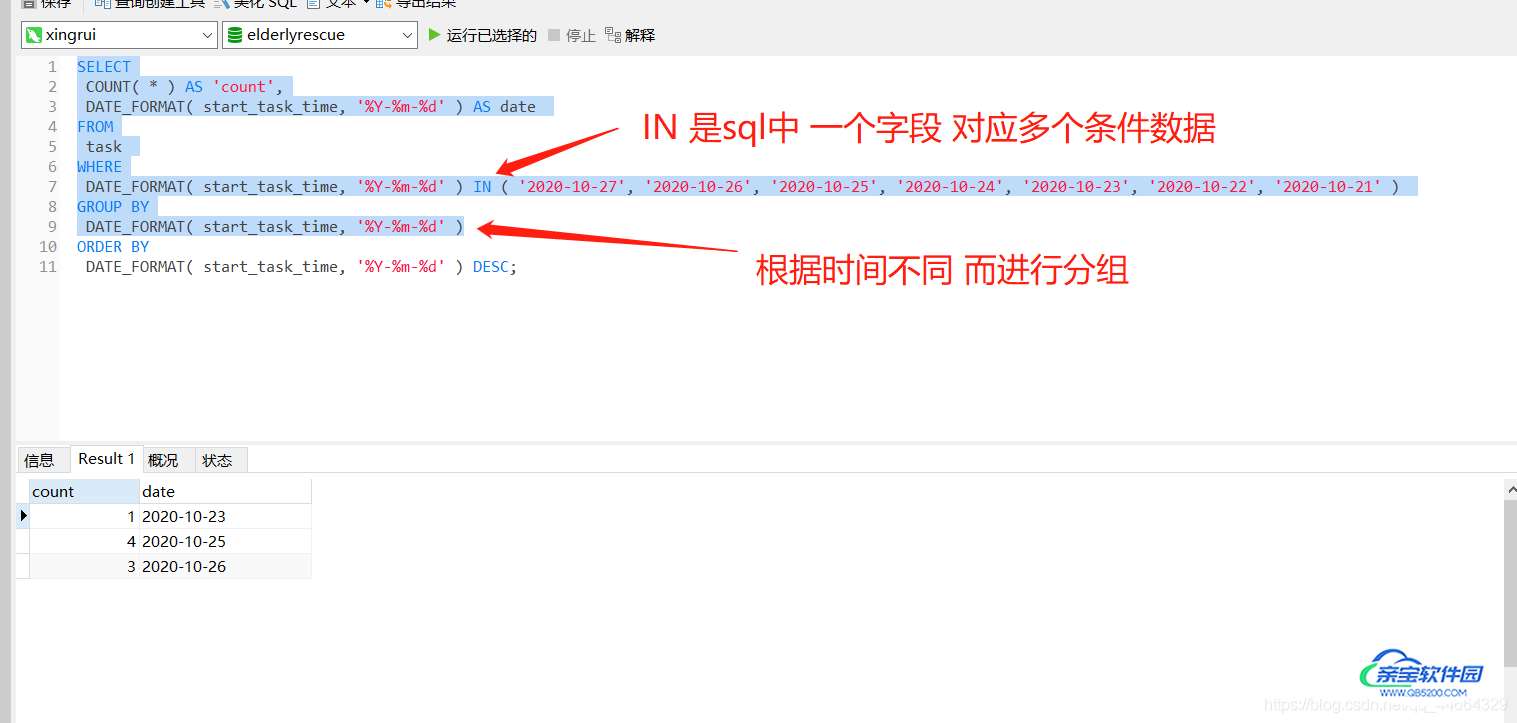
OK! 现在看完了sql 来看最后的查询结果 。
现在发现如果哪一天有数据的话是可以查询出来并分组的,如何没有数据是查询不出来的 。
但是我们查询出近七天的数据,如果没有值就补全为0。
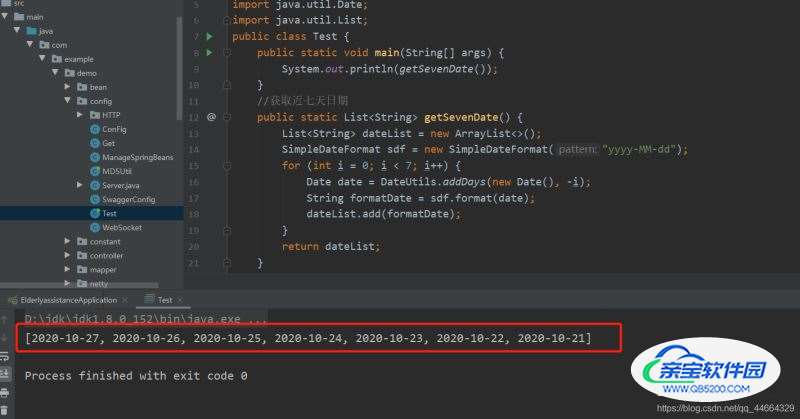
获取Java内每次从今天开始到前六天的日期数据
补全剩下没有日期的数据,这里就需要我们Java逻辑来实现了。
首先刚刚的sql语句条件是自己写的 在java里面我们可不能手写要每次都动态的获取从今天开始到前六日的日期数据共七天。
那么上Java代码 获取近七天的日期
 //获取近七天日期
    public static List<String> getSevenDate() {
        List<String> dateList = new ArrayList<>();
        SimpleDateFormat sdf = new SimpleDateFormat("yyyy-MM-dd");
        for (int i = 0; i < 7; i++) {
            Date date = DateUtils.addDays(new Date(), -i);
            String formatDate = sdf.format(date);
            dateList.add(formatDate);
        }
        return dateList;
    }
将查询出来数据做逻辑处理 之后返回json字符串
在java中获取到了最新的近七天的日期 现在将日期和sql结合 在项目中查询出数据来。
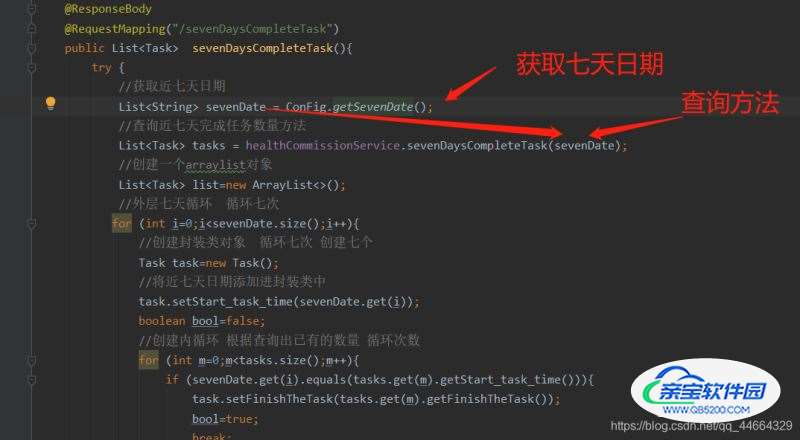
现在看接口,先看前两句,第一句是获取近七天数据,我把代码封装到工具类中了,直接调用的,第二句是将生成的日期作为参数,执行查询方法
这里看Mapper foreach 当中collection 传的是map就写map 传list就写list 这里咱们查询方法 默认就写list就行,item是集合中每一个元素进行迭代时的别名, 传的参数名叫什么这个就叫什么就可以。 其他的默认不用管
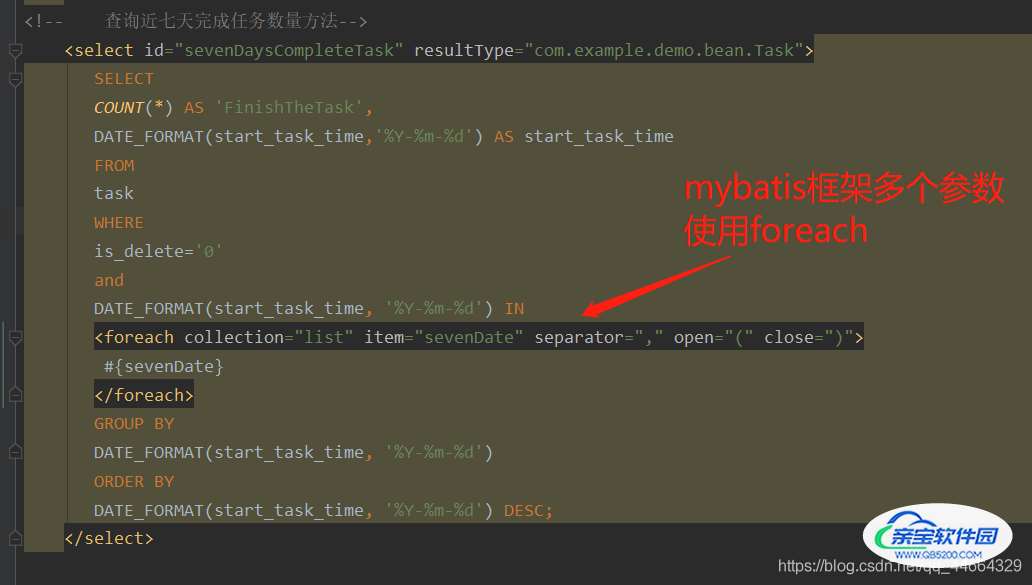
<select id="sevenDaysCompleteTask" resultType="com.example.demo.bean.Task">
       SELECT
       COUNT(*) AS 'FinishTheTask',
       DATE_FORMAT(start_task_time,'%Y-%m-%d') AS start_task_time
       FROM
       task
       WHERE
       is_delete='0'
       and
       DATE_FORMAT(start_task_time, '%Y-%m-%d') IN
       <foreach collection="list" item="sevenDate" separator="," open="(" close=")">
        #{sevenDate}
       </foreach>
       GROUP BY
       DATE_FORMAT(start_task_time, '%Y-%m-%d')
       ORDER BY
       DATE_FORMAT(start_task_time, '%Y-%m-%d') DESC;
    </select>
写完后我们测试一下看看查询出来的数据是什么样子
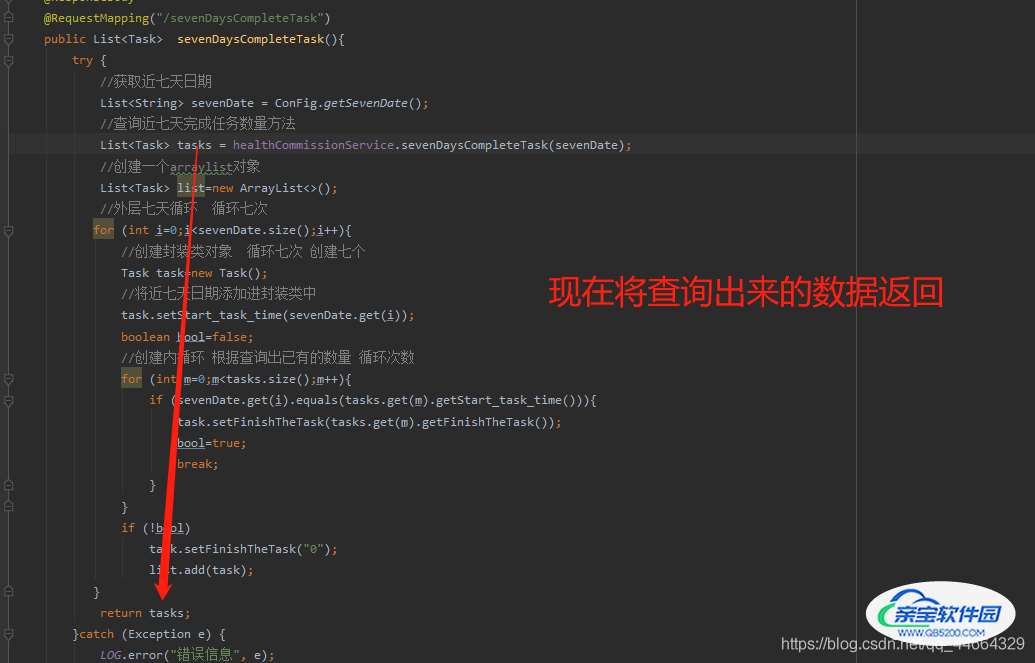
用postman测试了一下接口和在数据库查询返回的数据是一样的
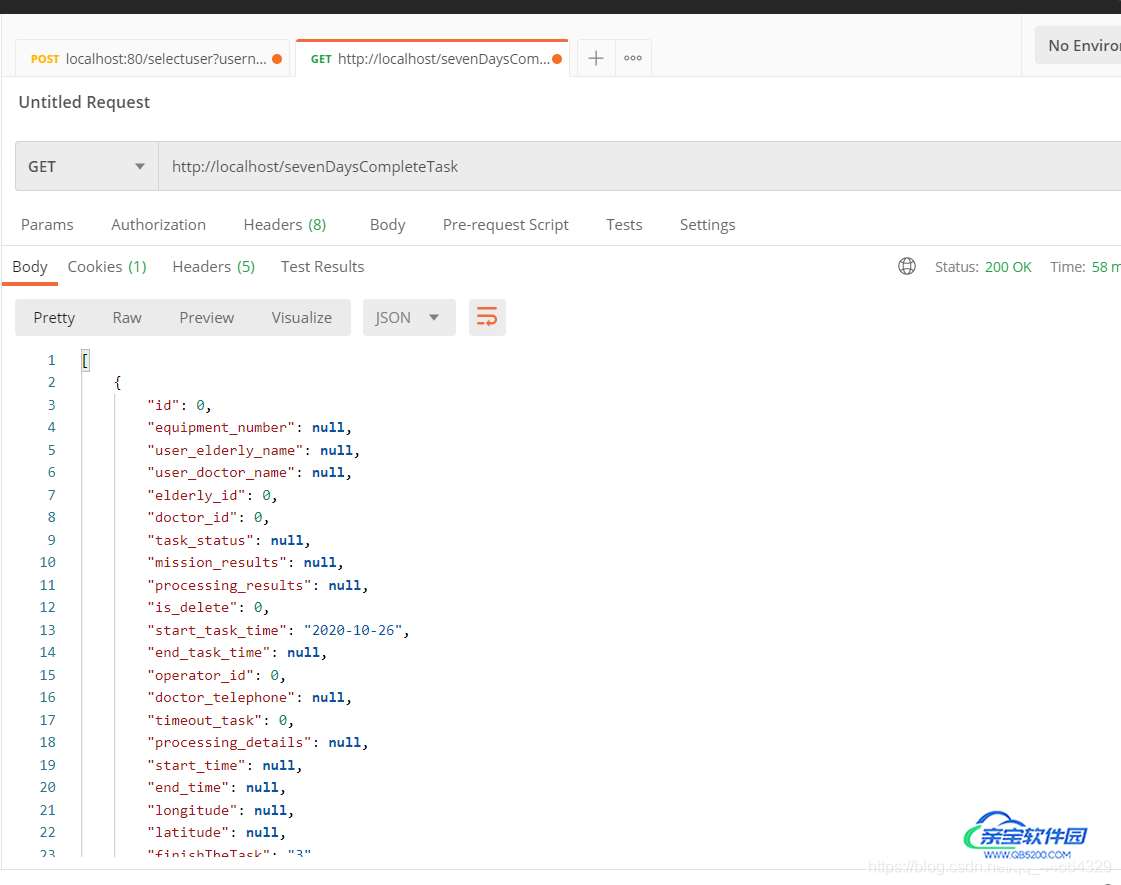
那么现在用java将没有的日期和数量进行补全
在开始写之前说一下编写思路
现在知道生成的日期长度是7 而数据库查询出来的数据长度是不一定的 因为只有那个日期有数据的话才能查询出来。
实现思路是 创建一个空的arraylist集合来放我们的封装类,循环创建封装类要创建七个,之后循环拿生成的时间和数据库查询出的时间做比较,如果一致就将查询出来的数据添加进封装类中,如果不一致就设置为0,因为我们要有七天的数据,所以要有七条数据,每一条数据一个封装类,共七个,之后循环的将封装类添加进arraylist集合中。
我不知道大家能不能看明白我所表达的意思 ,如果不明白也没关系,去看代码一句一句理解意思。
下面我上代码 我会一句一句解释意思
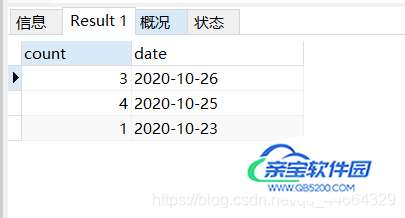
第三句创建一个arraylist对象 这个就是我们最后要返回的集合 这个不难理解
第四句 for循环 长度是我们生成日期数组长度 也就是七个
第五句 创建封装类 外圈循环七次 一共会创建七个封装类 一个封装类代表一条数据
第六句 创建boolean类型变量 ,用来判断生成的日期和查询出的日期是否一致,默认为false
第七句 创建小循环 目的是每次小循环都去循环查询出来的日期 一个一个的跟生成出的日期比较,如果一致就将查询出的数据添加进封装类中,并且设置boolean类型为true 不让进入设置0的判断,并结束此次小循环,开始第二次大循环。
第八句 将查询出的数据添加进封装类中
第九句 设置boolean类型为true
第十句 结束此次小循环 break
第十一句 每次大循环都要判断 是否进入了循环内部判断 如果进入就不设置0 如果没有进入就设置为0
第十二句 将每次的封装类添加到list集合中 并最后返回
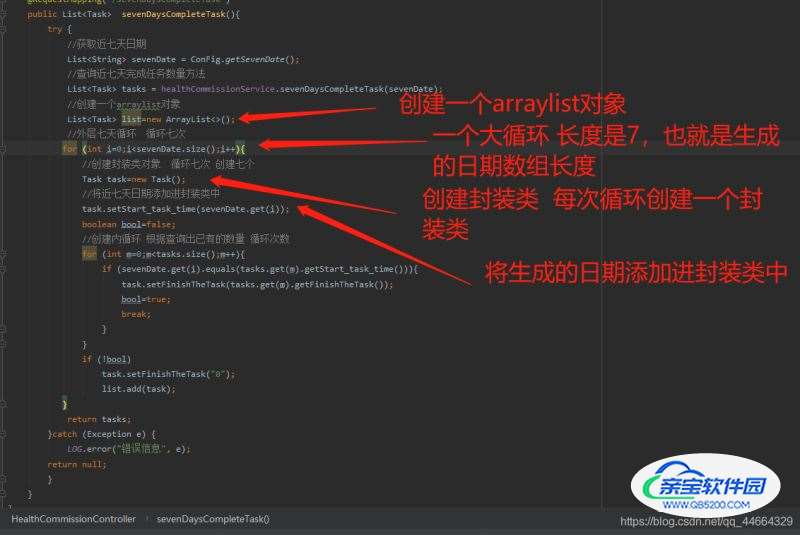
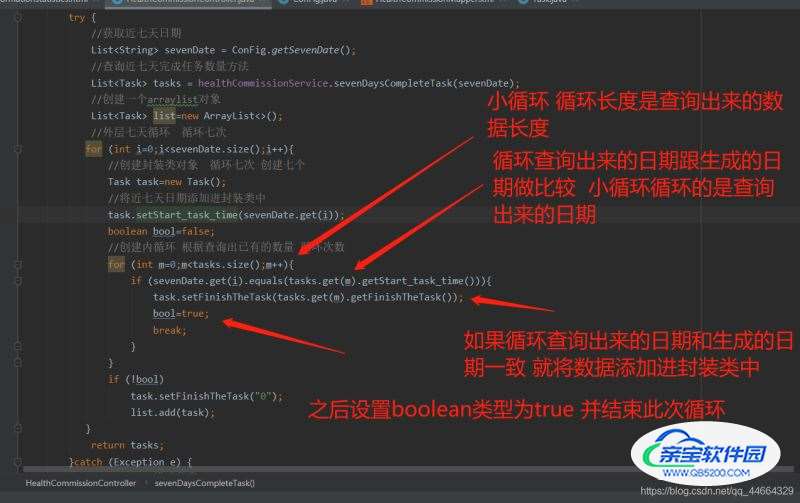
上面图片有点误差 最后的list要放到外面
@ResponseBody
    @RequestMapping("/sevenDaysCompleteTask")
    public List<Task>  sevenDaysCompleteTask(){
        try {
            //获取近七天日期
            List<String> sevenDate = ConFig.getSevenDate();
            //查询近七天完成任务数量方法
            List<Task> tasks = healthCommissionService.sevenDaysCompleteTask(sevenDate);
            //创建一个arraylist对象
            List<Task> list=new ArrayList<>();
            //外层七天循环  循环七次
           for (int i=0;i<sevenDate.size();i++){
               //创建封装类对象  循环七次 创建七个
               Task task=new Task();
               //将近七天日期添加进封装类中
               task.setStart_task_time(sevenDate.get(i));
               boolean bool=false;
               //创建内循环 根据查询出已有的数量 循环次数
               for (int m=0;m<tasks.size();m++){
                   if (sevenDate.get(i).equals(tasks.get(m).getStart_task_time())){
                       task.setFinishTheTask(tasks.get(m).getFinishTheTask());
                       bool=true;
                       break;
                   }
               }
               if (!bool) {
                   task.setFinishTheTask("0");
               }
                   list.add(task);
           }
            return list;
        }catch (Exception e) {
            LOG.error("错误信息", e);
        return null;
        }
    }
好了 java的逻辑已经完成了 最后看一下返回的数据

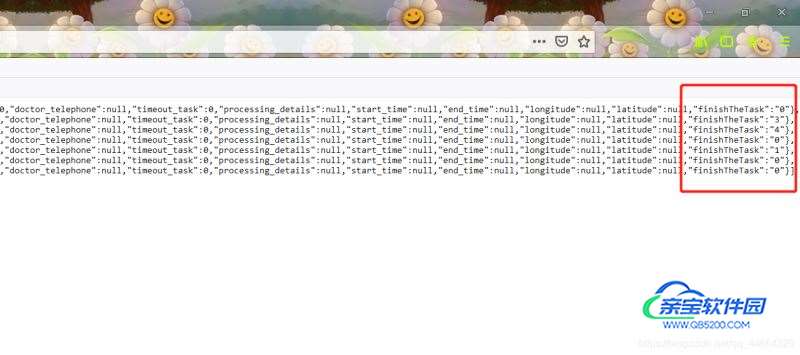
现在成功的吧没有数据的日期也添加到集合并且返回了
前端使用ajax对接接口 将获取的数据对接到echarts表图上面
OK!! 最后一步 对接echarts图表
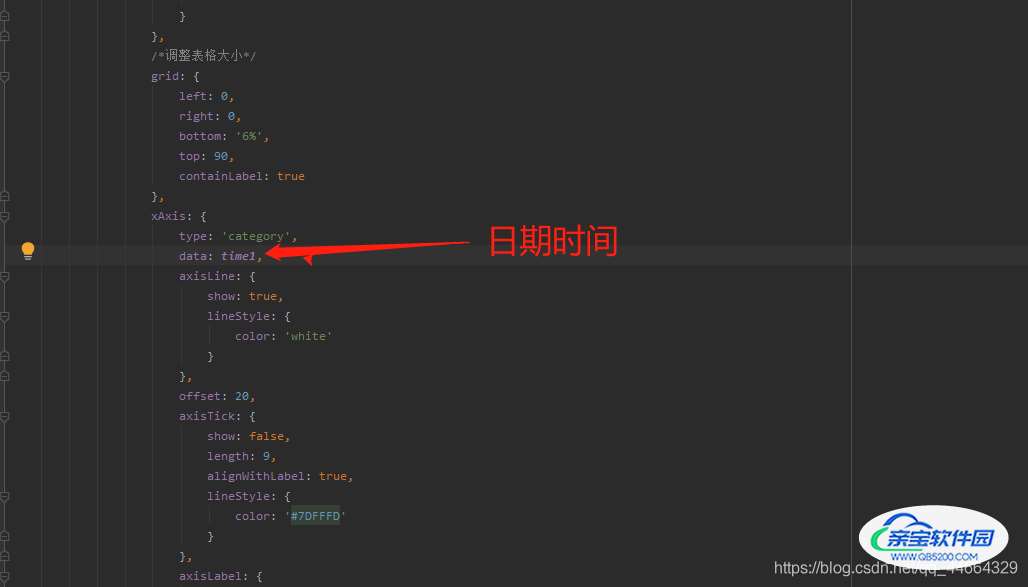
打开html 在图表的js里面先创建两个 数组 一个代表时间 一个代表数量 也就是图表当中的这两部分
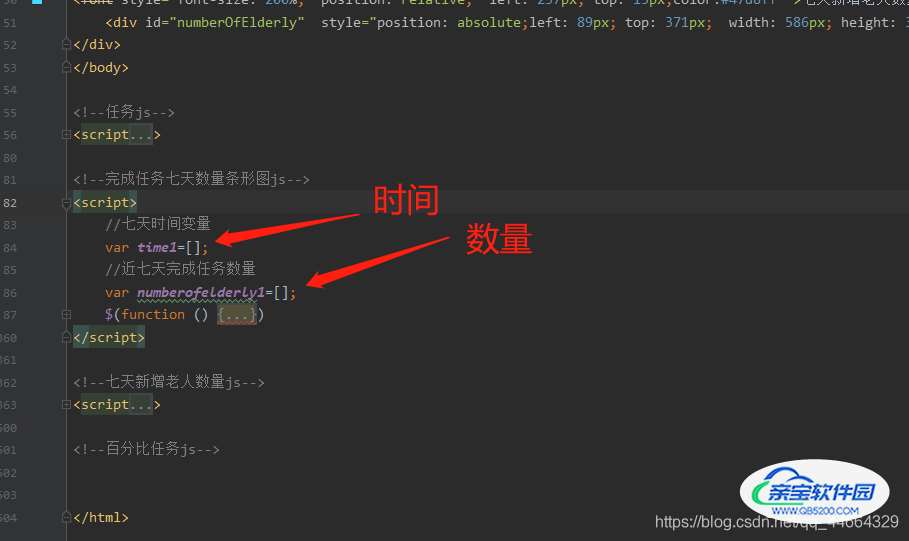
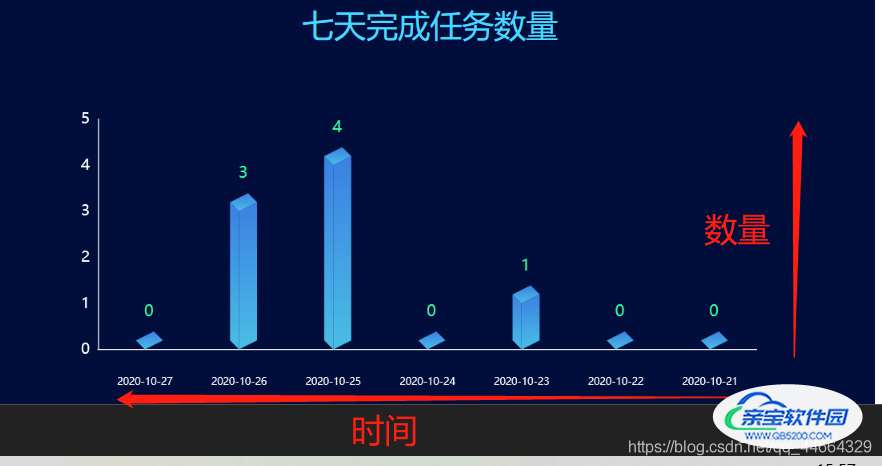
使用ajax 对接接口 用each循环将返回的json数据添加进两个数组中
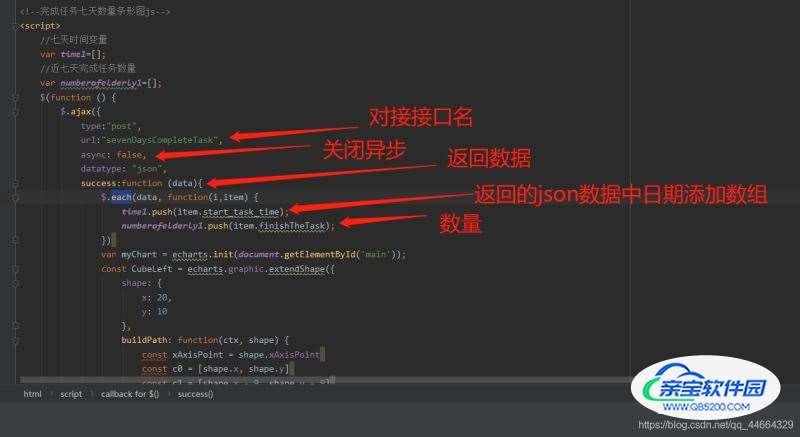
将数据添加进去后 把数组放入echarts图表中
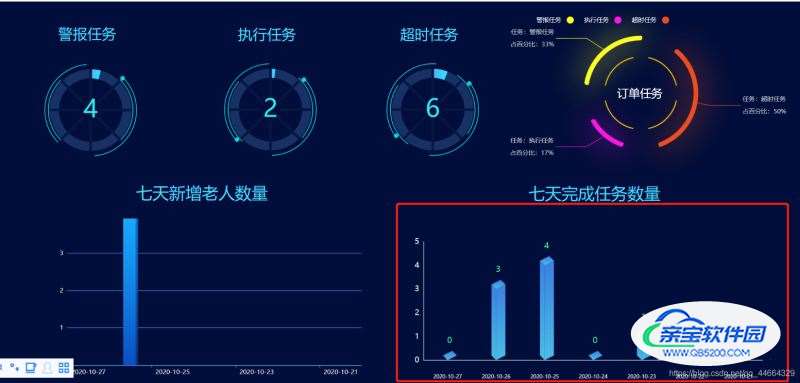
这里就结束了 看成品效果
最后放js代码 比较长
<!--完成任务七天数量条形图js-->
<script>
//七天时间变量
var time1=[];
//近七天完成任务数量
var numberofelderly1=[];
$(function () {
$.ajax({
type:"post",
url:"sevenDaysCompleteTask",
async: false,
datatype: "json",
success:function (data){
$.each(data, function(i,item) {
time1.push(item.start_task_time);
numberofelderly1.push(item.finishTheTask);
})
var myChart = echarts.init(document.getElementById('main'));
const CubeLeft = echarts.graphic.extendShape({
shape: {
x: 20,
y: 10
},
buildPath: function(ctx, shape) {
const xAxisPoint = shape.xAxisPoint
const c0 = [shape.x, shape.y]
const c1 = [shape.x - 9, shape.y - 9]
const c2 = [xAxisPoint[0] - 9, xAxisPoint[1] - 9]
const c3 = [xAxisPoint[0], xAxisPoint[1]]
ctx.moveTo(c0[0], c0[1]).lineTo(c1[0], c1[1]).lineTo(c2[0], c2[1]).lineTo(c3[0], c3[1]).closePath()
}
})
const CubeRight = echarts.graphic.extendShape({
shape: {
x: 10,
y: 10
},
buildPath: function(ctx, shape) {
const xAxisPoint = shape.xAxisPoint
const c1 = [shape.x, shape.y]
const c2 = [xAxisPoint[0], xAxisPoint[1]]
const c3 = [xAxisPoint[0] + 18, xAxisPoint[1] - 9]
const c4 = [shape.x + 18, shape.y - 9]
ctx.moveTo(c1[0], c1[1]).lineTo(c2[0], c2[1]).lineTo(c3[0], c3[1]).lineTo(c4[0], c4[1]).closePath()
}
})
const CubeTop = echarts.graphic.extendShape({
shape: {
x: 0,
y: 0
},
buildPath: function(ctx, shape) {
const c1 = [shape.x, shape.y]
const c2 = [shape.x + 18, shape.y - 9]
const c3 = [shape.x + 9, shape.y - 18]
const c4 = [shape.x - 9, shape.y - 9]
ctx.moveTo(c1[0], c1[1]).lineTo(c2[0], c2[1]).lineTo(c3[0], c3[1]).lineTo(c4[0], c4[1]).closePath()
}
})
echarts.graphic.registerShape('CubeLeft', CubeLeft)
echarts.graphic.registerShape('CubeRight', CubeRight)
echarts.graphic.registerShape('CubeTop', CubeTop)
const MAX = numberofelderly1
const VALUE = numberofelderly1
option = {
// backgroundColor: "#010d3a",
title: {
text: '',
top: 32,
left: 18,
textStyle: {
color: '#00F6FF',
fontSize: 24
}
},
/*调整表格大小*/
grid: {
left: 0,
right: 0,
bottom: '6%',
top: 90,
containLabel: true
},
xAxis: {
type: 'category',
data: time1,
axisLine: {
show: true,
lineStyle: {
color: 'white'
}
},
offset: 20,
axisTick: {
show: false,
length: 9,
alignWithLabel: true,
lineStyle: {
color: '#7DFFFD'
}
},
axisLabel: {
fontSize: 10
}
},
yAxis: {
type: 'value',
axisLine: {
show: true,
lineStyle: {
color: 'white'
}
},
splitLine: {
show: false
},
axisTick: {
show: false
},
axisLabel: {
fontSize: 15
},
boundaryGap: ['0', '20%']
},
series: [{
type: 'custom',
renderItem: function(params, api) {
const location = api.coord([api.value(0), api.value(1)])
return {
type: 'group',
children: [{
type: 'CubeLeft',
shape: {
api,
xValue: api.value(0),
yValue: api.value(1),
x: location[0],
y: location[1],
xAxisPoint: api.coord([api.value(0), 0])
},
style: {
fill: 'rgba(7,29,97,.6)'
}
}, {
type: 'CubeRight',
shape: {
api,
xValue: api.value(0),
yValue: api.value(1),
x: location[0],
y: location[1],
xAxisPoint: api.coord([api.value(0), 0])
},
style: {
fill: 'rgba(10,35,108,.7)'
}
}, {
type: 'CubeTop',
shape: {
api,
xValue: api.value(0),
yValue: api.value(1),
x: location[0],
y: location[1],
xAxisPoint: api.coord([api.value(0), 0])
},
style: {
fill: 'rgba(11,42,106,.8)'
}
}]
}
},
data: MAX
}, {
type: 'custom',
renderItem: (params, api) => {
const location = api.coord([api.value(0), api.value(1)])
return {
type: 'group',
children: [{
type: 'CubeLeft',
shape: {
api,
xValue: api.value(0),
yValue: api.value(1),
x: location[0],
y: location[1],
xAxisPoint: api.coord([api.value(0), 0])
},
style: {
fill: new echarts.graphic.LinearGradient(0, 0, 0, 1, [{
offset: 0,
color: '#3B80E2'
},
{
offset: 1,
color: '#49BEE5'
}
])
}
}, {
type: 'CubeRight',
shape: {
api,
xValue: api.value(0),
yValue: api.value(1),
x: location[0],
y: location[1],
xAxisPoint: api.coord([api.value(0), 0])
},
style: {
fill: new echarts.graphic.LinearGradient(0, 0, 0, 1, [{
offset: 0,
color: '#3B80E2'
},
{
offset: 1,
color: '#49BEE5'
}
])
}
}, {
type: 'CubeTop',
shape: {
api,
xValue: api.value(0),
yValue: api.value(1),
x: location[0],
y: location[1],
xAxisPoint: api.coord([api.value(0), 0])
},
style: {
fill: new echarts.graphic.LinearGradient(0, 0, 0, 1, [{
offset: 0,
color: '#3B80E2'
},
{
offset: 1,
color: '#49BEE5'
}
])
}
}]
}
},
data: VALUE
}, {
type: 'bar',
label: {
normal: {
show: true,
position: 'top',
formatter: (e) => {
switch (e.name) {
case '10kV线路':
return VALUE[0]
case '公用配变':
return VALUE[1]
case '35kV主变':
return VALUE[2]
case '水':
}
},
fontSize: 16,
color: '#38ff9f',
offset: [4, -25]
}
},
itemStyle: {
color: 'transparent'
},
data: MAX
}]
}
myChart.setOption(option);
}
})
})
</script>加载全部内容