Python绘制正二十面体图形示例
微小冷 人气:0正二十面体的顶点
正20面体的12个顶点刚好可以分为三组,每一组都是一个符合黄金分割比例的长方形,而且这三个长方形是互相正交的。
所以,想绘制一个正二十面体是比较容易的
import numpy as np
from itertools import product
G = (np.sqrt(5)-1)/2
def getVertex():
pt2 = [(a,b) for a,b in product([1,-1], [G, -G])]
pts = [(a,b,0) for a,b in pt2]
pts += [(0,a,b) for a,b in pt2]
pts += [(b,0,a) for a,b in pt2]
return np.array(pts)
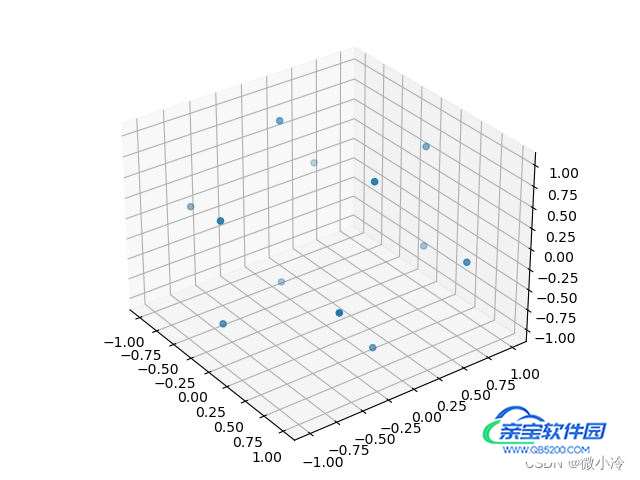
xs, ys zs = getVertex().T
ax = plt.subplot(projection='3d')
ax.scatter(xs, ys, zs)
plt.show()
得到顶点
绘制棱
接下来将这些顶点连接成线,由于总共只有12个顶点,所以两两相连,也不至于导致运算量爆炸。另一方面,正二十面体的边长是相同的,而这些相同的边连接的也必然是最近的点,所以接下来只需建立顶点之间的距离矩阵,然后将距离最短的线抽出来即可。
def getDisMat(pts):
    N = len(pts)
    dMat = np.ones([N,N])*np.inf
    for i in range(N):
        for j in range(i):
            dMat[i,j] = np.linalg.norm([pts[i]-pts[j]])
    return dMat

pts = getVertex()
dMat = getDisMat(pts)
# 由于存在舍入误差,所以得到的边的数值可能不唯一
ix, jx = np.where((dMat-np.min(dMat))<0.01)
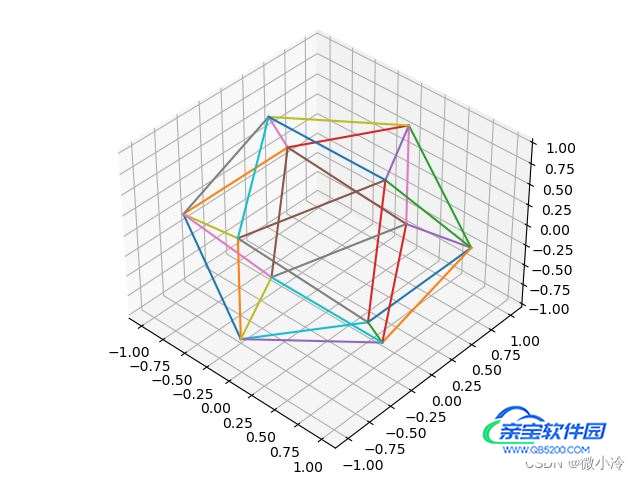
接下来,绘制正二十面体的棱
edges = [pts[[i,j]] for i,j in zip(ix, jx)]

ax = plt.subplot(projection='3d')
for pt in edges:
    ax.plot(*pt.T)

plt.show()
效果如图所示
绘制面
当然,只是有棱还显得不太好看,接下来要对正二十面体的面进行上色。由于三条棱构成一个面,所以只需得到所有三条棱的组合,然后判定这三条棱是否可以组成一个三角形,就可以获取所有的三角面。当然,这一切的前提是,正二十面体只有30个棱,即使遍历多次,也无非27k的计算量,是完全没问题的。
def isFace(e1, e2, e3):
    pts = np.vstack([e1, e2, e3])
    pts = np.unique(pts, axis=0)
    return len(pts)==3

from itertools import combinations
faces = [es for es in combinations(edges, 3)
    if isFace(*es)]
接下来绘制一下
ax = plt.subplot(projection='3d')
for f in faces:
    pt = np.unique(np.vstack(f), axis=0)
    try:
        ax.plot_trisurf(*pt.T)
    except:
        pass

plt.show()
如图所示
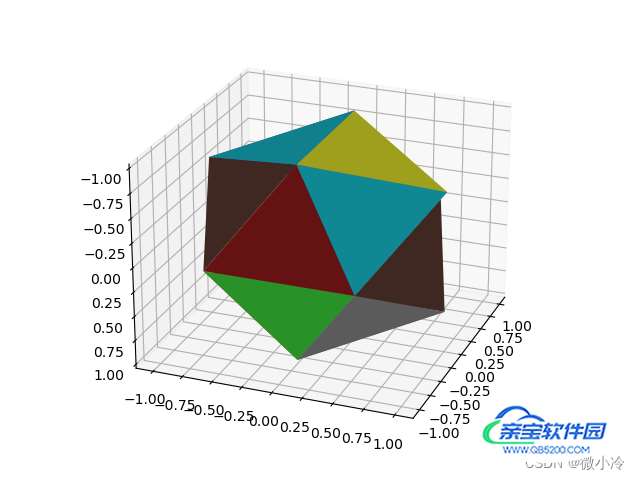
由于plot_trisurf的画图逻辑是,先绘制xy坐标系上的三角形,然后再以此为三角形建立z轴坐标。所以这会导致一个Bug,即所绘制的三角面不能垂直于xy坐标系,为了让正二十面体被完整地绘制出来,可以对其绕着x和y轴旋转一下,当然首先要建立一个旋转矩阵。三维空间中的旋转矩阵如下表所示。详情可参考博客:Python动态演示旋转矩阵的作用

写成代码为
# 将角度转弧度后再求余弦
cos = lambda th : np.cos(np.deg2rad(th))
sin = lambda th : np.sin(np.deg2rad(th))

# 即 Rx(th) => Matrix
Rx = lambda th : np.array([
    [1, 0,       0],
    [0, cos(th), -sin(th)],
    [0, sin(th), cos(th)]])
Ry = lambda th : np.array([
    [cos(th),  0, sin(th)],
    [0      ,  1, 0],
    [-sin(th), 0, cos(th)]
])
然后绘图函数
ax = plt.subplot(projection='3d')
for f in faces:
    pt = np.unique(np.vstack(f), axis=0)
    pt = Rx(1)@Ry(1)@pt.T
    ax.plot_trisurf(*pt)

for pt in edges:
    pt = Rx(1)@Ry(1)@pt.T
    ax.plot(*pt, lw=2, color='blue')

plt.show()
效果如下

总结
加载全部内容