Vue ECharts设置主题实现方法介绍
爱学习de测试小白 人气:0前言
本篇来学习下ECharts中如何设置图表主题
内置主题
ECharts 中默认内置了两套主题: light dark
var chart = echarts.init(dom, 'light')
var chart = echarts.init(dom, 'dark')
<!DOCTYPE html>
<html lang="en">
<head>
    <meta charset="UTF-8">
    <meta name="viewport" content="width=device-width, initial-scale=1.0">
    <meta http-equiv="X-UA-Compatible" content="ie=edge">
    <title>ECharts高级--主题</title>
    <script src="https://cdn.jsdelivr.net/npm/echarts@5.4.1/dist/echarts.min.js"></script>
</head>
<body>
<div id='app' style="width: 600px;height: 400px"></div>
<script>
    // init方法有两个参数, 第一个参数代表是一个dom节点, 第二个参数, 代表你需要使用哪一套主题
    // 默认内置了两套主题 , light  dark
    var myCharts = echarts.init(document.getElementById('app'), 'dark')
    var option = {
        xAxis: {
            type: 'category',   // 类目轴
            data: ['测试', '研发', '产品']
        },
        yAxis: {
            type: 'value' // 数值轴
        },
        title: {
            text: '岗位',  // 标题文本
            link: 'https://blog.csdn.net/IT_heima', // 标题超链接
            target: 'blank',    // 打开新窗口,  self: 当前窗口
            textStyle: {    // 文字样式
                color: 'pink', // 颜色
                fontWeight: 'bold' // 字体粗细
            }
        },
        series: [
            {
                name: '岗位',
                type: 'bar',  // 图表类型  bar:柱状图   line:折线图   pie:饼图
                data: [10, 90, 20],
                barWidth: '30%',
                label: {
                    show: true,
                    rotate: 20
                }
            }
        ]
    }
    myCharts.setOption(option)
</script>
</body>
</html>
效果

自定义主题
主题编辑器地址:https://echarts.apache.org/zh/theme-builder.html
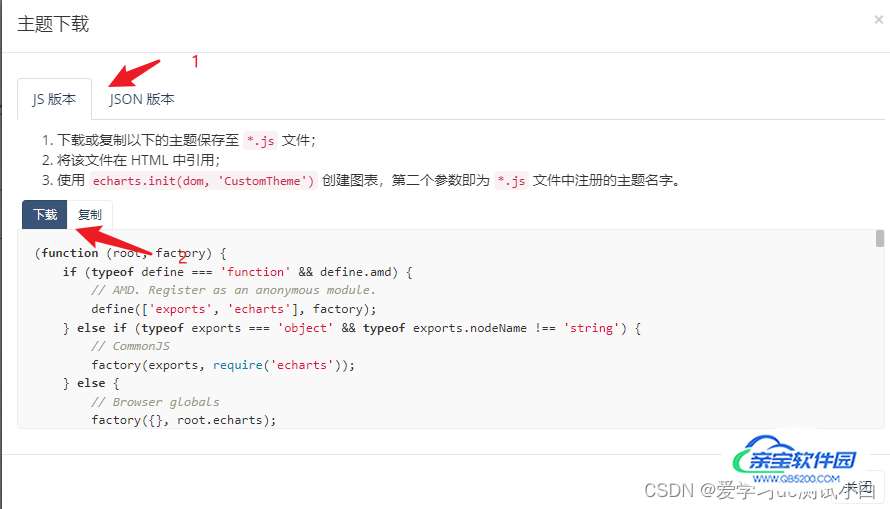
下载主题(保存为js文件)


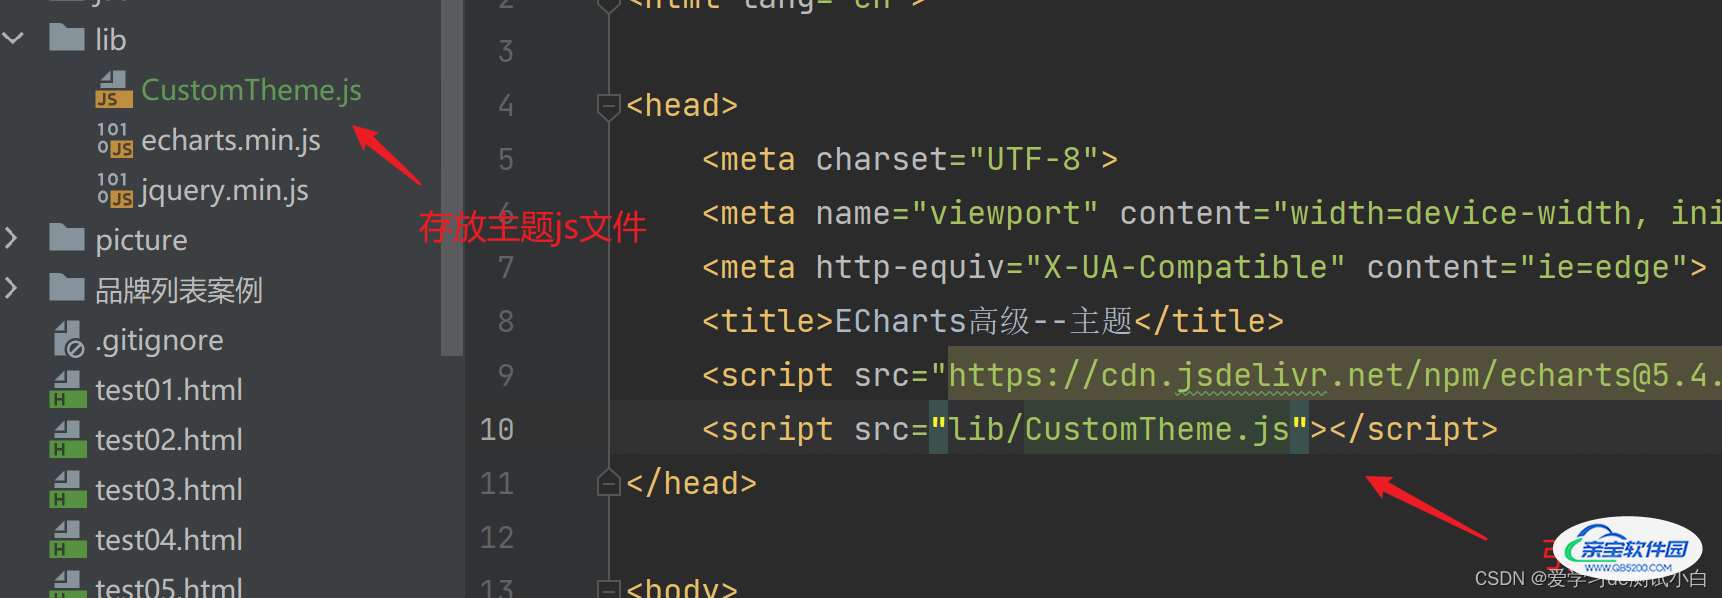
引入主题 js 文件(以主题名称命名的js文件)

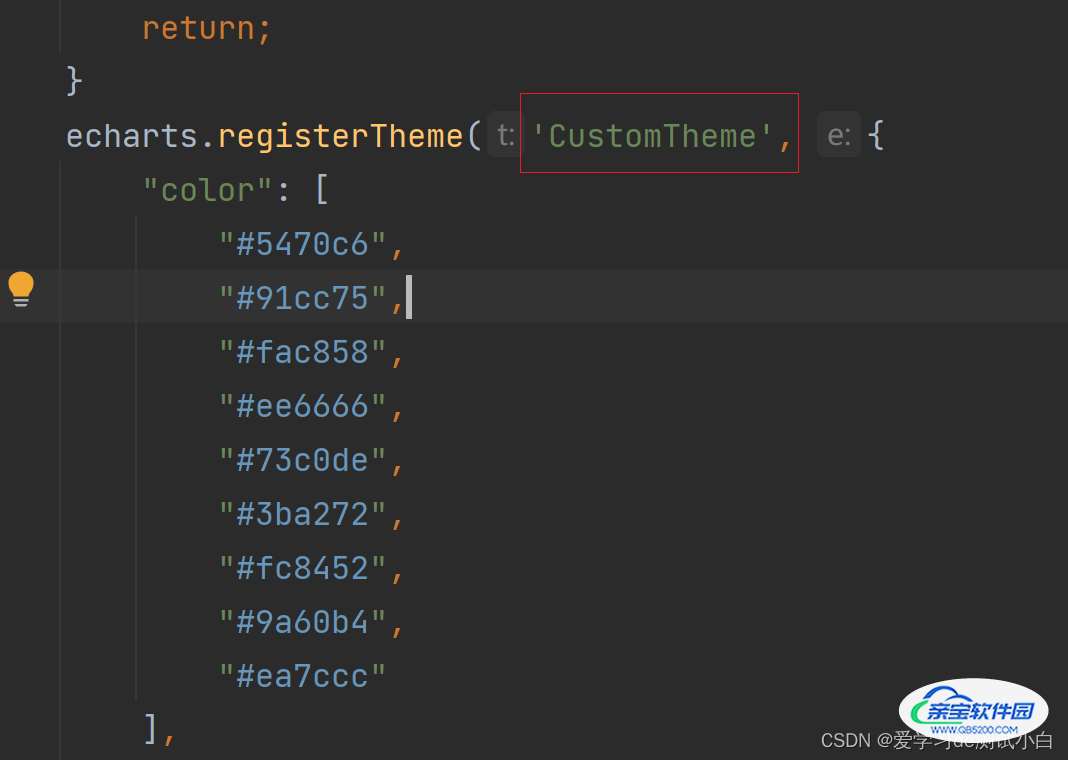
在 init 方法中使用主题
一般是下载时自定义的主题名称(可在下载的主题js文件中找到名称)

完整代码
<!DOCTYPE html>
<html lang="en">
<head>
    <meta charset="UTF-8">
    <meta name="viewport" content="width=device-width, initial-scale=1.0">
    <meta http-equiv="X-UA-Compatible" content="ie=edge">
    <title>ECharts高级--主题</title>
    <script src="https://cdn.jsdelivr.net/npm/echarts@5.4.1/dist/echarts.min.js"></script>
    <script src="lib/CustomTheme.js"></script>
</head>
<body>
<div id='app' style="width: 600px;height: 400px"></div>
<script>
    // init方法有两个参数, 第一个参数代表是一个dom节点, 第二个参数, 代表你需要使用哪一套主题
    var myCharts = echarts.init(document.getElementById('app'), 'CustomTheme')
    var option = {
        xAxis: {
            type: 'category',   // 类目轴
            data: ['测试', '研发', '产品']
        },
        yAxis: {
            type: 'value' // 数值轴
        },
        title: {
            text: '岗位',  // 标题文本
            link: 'https://blog.csdn.net/IT_heima', // 标题超链接
            target: 'blank',    // 打开新窗口,  self: 当前窗口
            textStyle: {    // 文字样式
                color: 'pink', // 颜色
                fontWeight: 'bold' // 字体粗细
            }
        },
        series: [
            {
                name: '岗位',
                type: 'bar',  // 图表类型  bar:柱状图   line:折线图   pie:饼图
                data: [10, 90, 20],
                barWidth: '30%',
                label: {
                    show: true,
                    rotate: 20
                }
            }
        ]
    }
    myCharts.setOption(option)
</script>
</body>
</html>
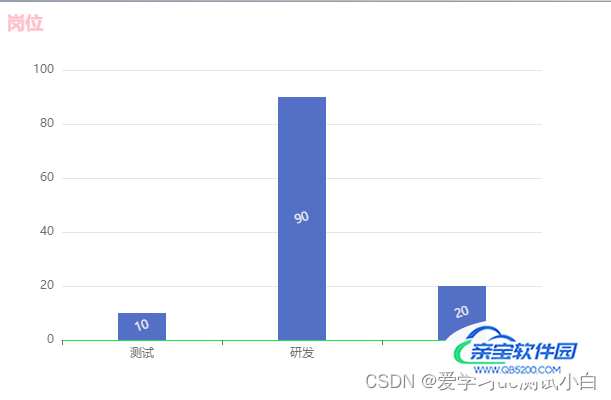
效果:与预览效果一致,类目轴颜色修改为浅绿色

加载全部内容