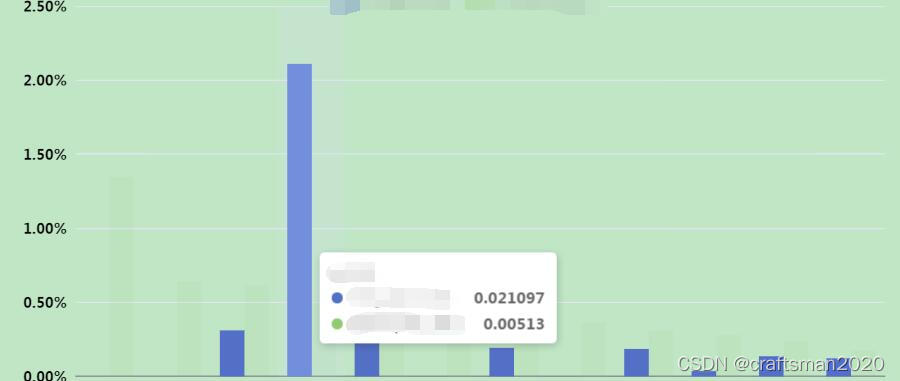
vue3 echarts的tooltip组件不显示
东之健大坏蛋 人气:0vue3 echarts的tooltip组件不显示
data() {
  return {
    chartInstance: ''
  }
},

mounted() {
  if(!this.chartInstance) this.chartInstance = echarts.init(this.$refs.myChart)
  this.chartInstance.setOption(option)
}
如图,我将echarts实例赋值给了响应式的变量this.chartInstance,这便是在vue3中出错的原因,即不能将echarts实例赋值给响应式变量。
解决办法
①
this.$echarts.init(this.$refs.myChart).setOption(option)
②如果我们需要多次在一个dom元素上绘制echarts,又不想让元素多次echarts实例化,可以使用getInstanceByDom方法
let el = this.$refs.myChart
if(this.$echarts.getInstanceByDom(el)) this.$echarts.getInstanceByDom(el).setOption(option)
else this.$echarts.init(el).setOption(option)
Echarts|tooltip提示框组件参数
Echarts数据可视化tooltip提示框组件详解:
tooltip ={                                      //提示框组件
    trigger: 'item',                            //触发类型,'item'数据项图形触发,主要在散点图,饼图等无类目轴的图表中使用。 'axis'坐标轴触发,主要在柱状图,折线图等会使用类目轴的图表中使用。
    triggerOn:"mousemove",                      //提示框触发的条件,'mousemove'鼠标移动时触发。'click'鼠标点击时触发。'mousemove|click'同时鼠标移动和点击时触发。'none'不在 'mousemove' 或 'click' 时触发
    showContent:true,                           //是否显示提示框浮层
    alwaysShowContent:true,                     //是否永远显示提示框内容
    showDelay:0,                                  //浮层显示的延迟,单位为 ms
    hideDelay:100,                                //浮层隐藏的延迟,单位为 ms
    enterable:false,                             //鼠标是否可进入提示框浮层中
    confine:false,                               //是否将 tooltip 框限制在图表的区域内
    transitionDuration:0.4,                      //提示框浮层的移动动画过渡时间,单位是 s,设置为 0 的时候会紧跟着鼠标移动
    position:['50%', '50%'],                    //提示框浮层的位置,默认不设置时位置会跟随鼠标的位置,[10, 10],回掉函数,inside鼠标所在图形的内部中心位置,top、left、bottom、right鼠标所在图形上侧,左侧,下侧,右侧,
    formatter:"{b0}: {c0}<br />{b1}: {c1}",     //提示框浮层内容格式器,支持字符串模板和回调函数两种形式,模板变量有 {a}, {b},{c},{d},{e},分别表示系列名,数据名,数据值等
    backgroundColor:"transparent",            //标题背景色
    borderColor:"#ccc",                        //边框颜色
    borderWidth:0,                              //边框线宽
    padding:5,                                  //图例内边距,单位px  5  [5, 10]  [5,10,5,10]
    textStyle:mytextStyle,                     //文本样式
};
以上为个人经验,希望能给大家一个参考,也希望大家多多支持。
加载全部内容