python画图中文不显示
sinysama 人气:0前言
python画图,如果用英文显示基本没有问题,但是中文可能会有乱码或者不显示的情况。
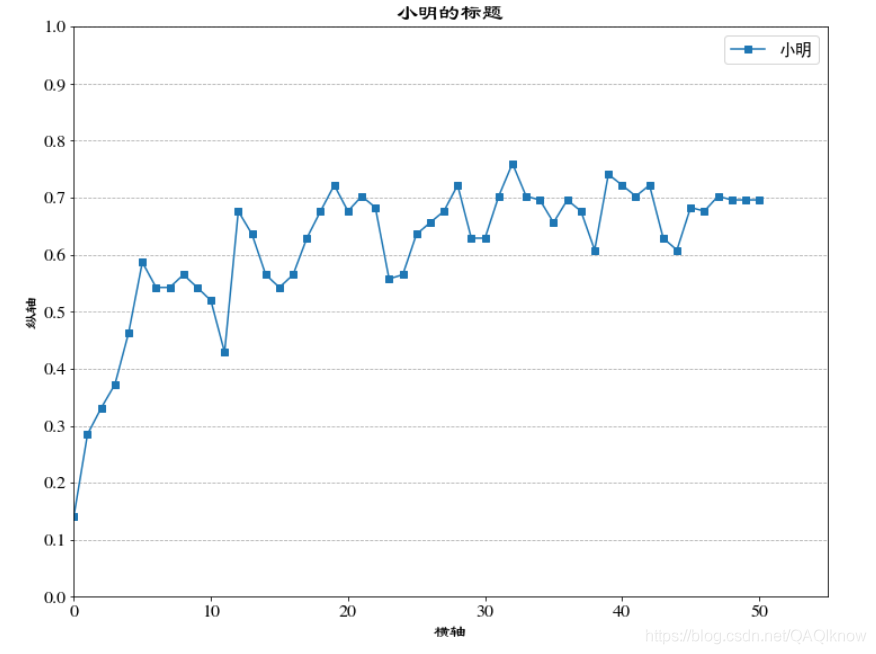
经过个人的测试,下图中“横轴”,“纵轴”字样的中文显示没有什么大问题,主要是plt.title部分和plt.plot部分的显示

一、plt.title中文显示的解决:
from matplotlib.font_manager import FontProperties
font_set = FontProperties(fname=r"c:\windows\fonts\SIMLI.TTF", size=15)
plt.title(u'小明的标题', FontProperties=font_set)
FontProperties中加载的就是本地的字体
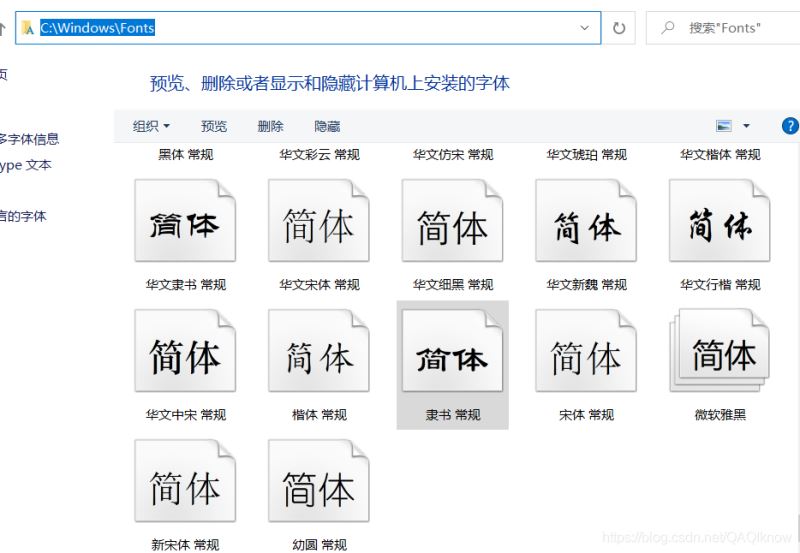
路径:C:\Windows\Fonts

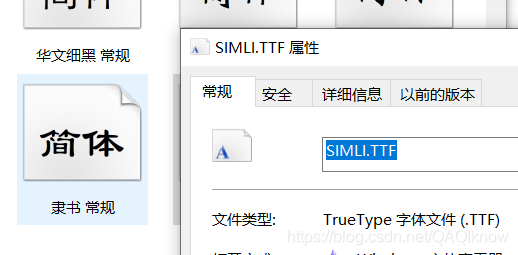
选中字体鼠标右键属性即可复制名字进行替换

font_set = FontProperties(fname=r"c:\windows\fonts\SIMLI.TTF", size=15)

从改变字体的结果来看,横纵坐标和标题区域受影响,plt.plot不受影响
二、plt.plot中文显示的解决:
与上述类似,加下列一行即可
plt.legend(prop={'family':'SimHei','size':15})
三、供参考代码
from matplotlib import pyplot
import matplotlib.pyplot as plt
from matplotlib.font_manager import FontProperties
from matplotlib.ticker import MultipleLocator, FormatStrFormatter
font_set = FontProperties(fname=r"c:\windows\fonts\simsun.ttc", size=15)
import matplotlib
import numpy as np
%matplotlib inline

plt.rcParams['figure.figsize'] = (12.0, 8.0) # set default size of plots
plt.rcParams['image.interpolation'] = 'nearest'
plt.rcParams['image.cmap'] = 'gray'
# plt.rcParams['font.sans-serif']=['SimHei']
# plt.rcParams['axes.unicode_minus']=False
# 设置标题大小
plt.rcParams['font.size'] = '16'


fig = plt.figure()
matplotlib.rcParams.update(
{
'text.usetex': False,
'font.family': 'stixgeneral',
'mathtext.fontset': 'stix',
}
)
# myfont = FontProperties(fname='/homenuxidc/.local/fonts/文泉驿正黑.ttf')


x = range(0,102,2)

x = [str(x) for x in list(x)]

x = range(len(x))

#这里如果取得值,最好省略,否则冗余代码太多
dj1=[0.140885022563663,0.285128051316358,0.331236115292078,0.372582750937596,0.463174450139405,0.586773503380428,0.542598182149781,0.542598182149781,0.564956686389027,0.542598182149781,0.519630577568173,0.428649426296771,0.676284101462148,0.635875231620977,0.564956686389027,0.542598182149781,0.564956686389027,0.62899995822798,0.676284101462148,0.721874028834649,0.676284101462148,0.702515362688485,0.682890636232397,0.557567115066442,0.564956686389027,0.635875231620977,0.656252254277025,0.676284101462148,0.721874028834649,0.62899995822798,0.62899995822798,0.702515362688485,0.759939881400332,0.702515362688485,0.696005029828444,0.656252254277025,0.696005029828444,0.676284101462148,0.608105164606941,0.741002175030875,0.721874028834649,0.702515362688485,0.721874028834649,0.62899995822798,0.608105164606941,0.682890636232397,0.676284101462148,0.702515362688485,0.696005029828444,0.696005029828444,0.696005029828444]

plt.plot(x, dj1,marker='s',label=u'小明')

plt.grid(linestyle='--')
plt.grid(axis="x")
plt.title(u'SimHei', fontproperties=font_set)
plt.title('小明的标题')
plt.legend()  # 让图例生效

y_major_locator=MultipleLocator(0.1)

ax=plt.gca()
ax.yaxis.set_major_locator(y_major_locator)
plt.ylim(0,1)

plt.xlim(0,55)

plt.margins(0)
plt.subplots_adjust(bottom=0.001)

plt.xlabel("横轴",fontproperties=font_set) #X轴标签
plt.ylabel("纵轴",fontproperties=font_set) #Y轴标签
plt.legend(prop={'family':'SimHei','size':15})
总结
加载全部内容