python绘制折线图和条形图
柠檬树下你和我₰ 人气:0最近开始写小论文啦,中间不免要作各种各样的图,学习后自己作了个小笔记,供小伙伴一起学习哦。
折线图
import matplotlib.pyplot as plt
#x轴取值不一样时
# x1=[0,0.1,0.3,0.5,0.7,0.8,0.9]
# y1=[0.7150,0.7147,0.7088,0.7029,0.6996,0.6942,0.5599]
# x2=[0,0.1,0.2,0.5,0.6,0.8,0.9,1]
# y2=[0.7150,0.7146,0.6969,0.6496,0.5568,0.5196,0.4248,0.3344]
# x3=[0,0.1,0.2,0.3,0.4,0.5,0.6,0.7,0.8,0.9,1]
# y3=[0.7150,0.7147,0.7068,0.7016,0.6283,0.5889,0.5155,0.4992,0.4728,0.3909,0.3310]

# x轴取值一样时
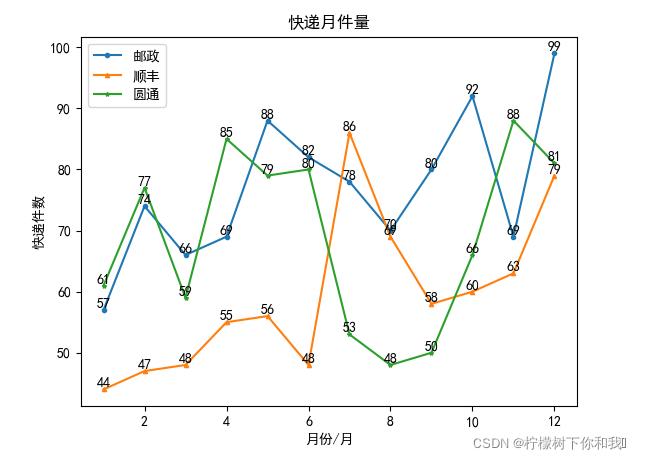
x = [1,2,3,4,5,6,7,8,9,10,11,12]
y1 = [57,74,66,69,88,82,78,70,80,92,69,99]
y2 = [44,47,48,55,56,48,86,69,58,60,63,79]
y3 = [61,77,59,85,79,80,53,48,50,66,88,81]

plt.title('快递月件量')  # 折线图标题

plt.rcParams['font.sans-serif'] = ['SimHei']  # 折线图中需显示汉字时,得加上这一行

plt.xlabel('月份/月')  # x轴标题
plt.ylabel('快递件数')  # y轴标题
plt.plot(x, y1, marker='o', markersize=3)  # 绘制折线图,添加数据点形状并设置点的大小
plt.plot(x, y2, marker='^', markersize=3)  #^:点的形状为三角形
plt.plot(x, y3, marker='*', markersize=3)  #星形

for a, b in zip(x, y1):
    plt.text(a, b, b, ha='center', va='bottom', fontsize=10)  # 设置数据标签位置及字体大小
for a, b in zip(x, y2):
    plt.text(a, b, b, ha='center', va='bottom', fontsize=10)
for a, b in zip(x, y3):
    plt.text(a, b, b, ha='center', va='bottom', fontsize=10)

plt.legend(['邮政', '顺丰', '圆通'])  # 设置折线名称

plt.show()  # 显示折线图
结果:

单条形图
import matplotlib.pyplot as plt

# 条形图需要显示中文时,需要下面这两行代码
plt.rcParams['font.sans-serif'] = ['SimHei']
plt.rcParams['axes.unicode_minus'] = False

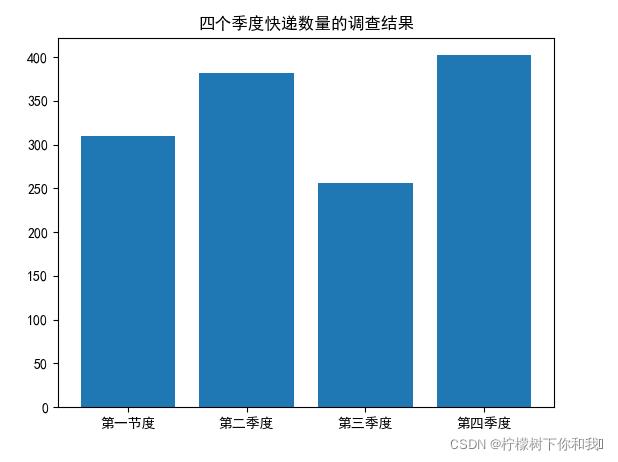
quarters = ('第一节度', '第二季度', '第三季度', '第四季度')  #x轴
courier_number = [310, 382, 256, 402]  #x轴对应的数量

plt.bar(quarters, courier_number)   #作图
#plt.barh(quarters, courier_number)  # 若要横放条形图,用函数barh
plt.title('四个季度快递数量的调查结果')  #条形图标题

plt.show()
结果:

并列条形图
import matplotlib.pyplot as plt
import numpy as np

# 条形图需要显示中文时,需要下面这两行代码
plt.rcParams['font.sans-serif'] = ['SimHei']
plt.rcParams['axes.unicode_minus'] = False

# 输入统计数据
quarters = ('第一节度', '第二季度', '第三季度', '第四季度')  #x轴
courier_number_before = [310, 382, 256, 402]
courier_number_now = [320, 420, 388, 432]

bar_width = 0.3  # 设置条形宽度
index_before = np.arange(len(quarters))  # 之前四季度条形图的横坐标
index_now = index_before + bar_width  # 现在四季度条形图的横坐标

# 使用两次 bar 函数画出两组条形图
plt.bar(index_before, height=courier_number_before, width=bar_width, color='b', label='去年')
plt.bar(index_now, height=courier_number_now, width=bar_width, color='g', label='今年')

plt.legend()  # 显示图例
plt.xticks(index_before + bar_width/2, quarters)  # 让横坐标轴刻度显示 四个季度的快递量, index_before + bar_width/2 为横坐标轴刻度的位置
plt.ylabel('快递数量')  # 纵坐标轴标题
plt.title('去年今年四个季度快递数量的调查结果')  # 图形标题

plt.show()
大家根据需要进行代码相应的改变。
加载全部内容