Python读取csv文件
空中旋转篮球 人气:01.运行环境及数据
Python3.7、PyCharm Community Edition 2021.1.1,win10系统。
使用的库:matplotlib、numpy、sklearn、pandas等
数据:CSV文件,包含时间,经纬度,高程等数据
2.基于时间序列的分析2D
读取时间列和高程做一下分析:
代码如下:
from PIL import Image
import matplotlib.pyplot as plt
import numpy as np
from sklearn.cluster import KMeans, MiniBatchKMeans
import pandas as pd

if __name__ == "__main__":
    data = pd.read_csv(r"H:\CSDN_Test_Data\UseYourTestData.csv")
    x, y = data['Time (sec)'], data['Height (m HAE)']
    n = len(x)
    x = np.array(x)
    x = x.reshape(n, 1)#reshape 为一列
    y = np.array(y)
    y = y.reshape(n, 1)#reshape 为一列
    data = np.hstack((x, y)) #水平合并为两列
    k = 8  # 设置颜色聚类的类别个数(我们分别设置8,16,32,64,128进行对比)
    cluster = KMeans(n_clusters=k)  # 构造聚类器
    C = cluster.fit_predict(data)
    # C_Image = cluster.fit_predict(data)
    print("训练总耗时为:%s(s)" % (Trainingtime).seconds)
    plt.figure()
    plt.scatter(data[:, 0], data[:, 1], marker='o', s=2, c=C)
    plt.show()
结果展示:
2.1 2000行数据结果展示
2.2 6950行数据结果展示
2.3 300M,约105万行数据结果展示
CPU立马90%以上了。大约1-2分钟,也比较快了。
markersize有些大了, 将markersize改小一些显示,设置为0.1,点太多还是不明显。
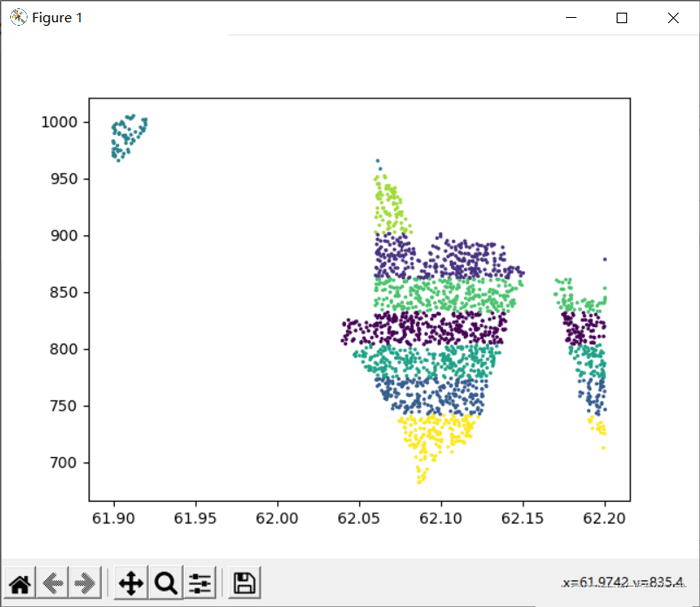
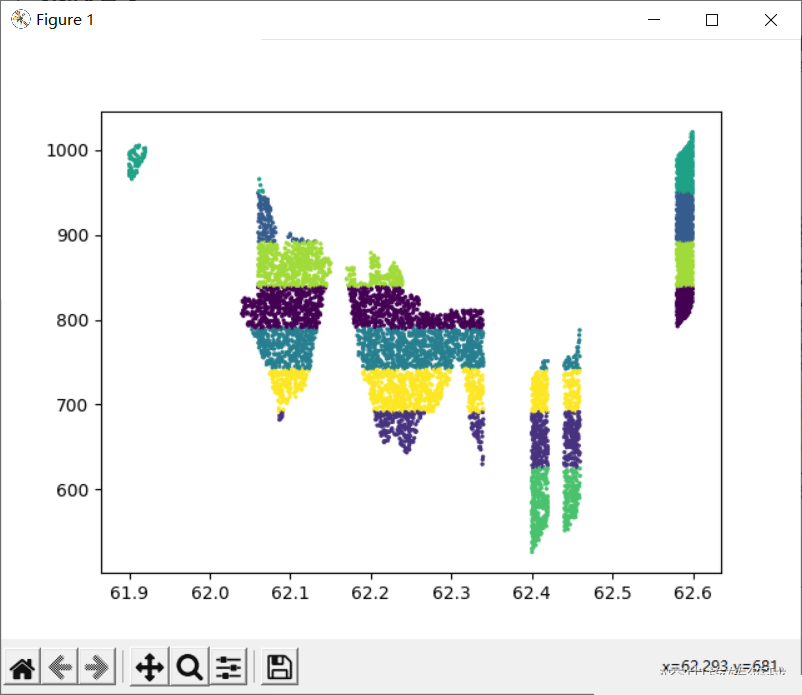
3.经纬度高程三维坐标分类显示3D-空间点聚类
修改代码,读取相应的列修改为X,Y,Z坐标:如下:
from PIL import Image
import matplotlib.pyplot as plt
import numpy as np
from sklearn.cluster import KMeans, MiniBatchKMeans
import pandas as pd
from mpl_toolkits.mplot3d import Axes3D
if __name__ == "__main__":
data = pd.read_csv(r"H:\CSDN_Test_Data\UseYourTestData.csv")
x, y,z = data['Longitude (deg)'],data['Latitude (deg)'], data['Height (m HAE)']
n = len(x)
x = np.array(x)
x = x.reshape(n, 1)#reshape 为一列
y = np.array(y)
y = y.reshape(n, 1)#reshape 为一列
z = np.array(z)
z = z.reshape(n, 1) # reshape 为一列
data = np.hstack((x, y, z)) #水平合并为两列
k = 8 # 设置颜色聚类的类别个数(我们分别设置8,16,32,64,128进行对比)
cluster = KMeans(n_clusters=k) # 构造聚类器
C = cluster.fit_predict(data)
# C_Image = cluster.fit_predict(data)
print("训练总耗时为:%s(s)" % (Trainingtime).seconds)
fig = plt.figure()
ax = Axes3D(fig)
ax.scatter(data[:, 0], data[:, 1],data[:, 2], s=1, c=C)
# 绘制图例
ax.legend(loc='best')
# 添加坐标轴
ax.set_zlabel('Z Label', fontdict={'size': 15, 'color': 'red'})
ax.set_ylabel('Y Label', fontdict={'size': 15, 'color': 'red'})
ax.set_xlabel('X Label', fontdict={'size': 15, 'color': 'red'})
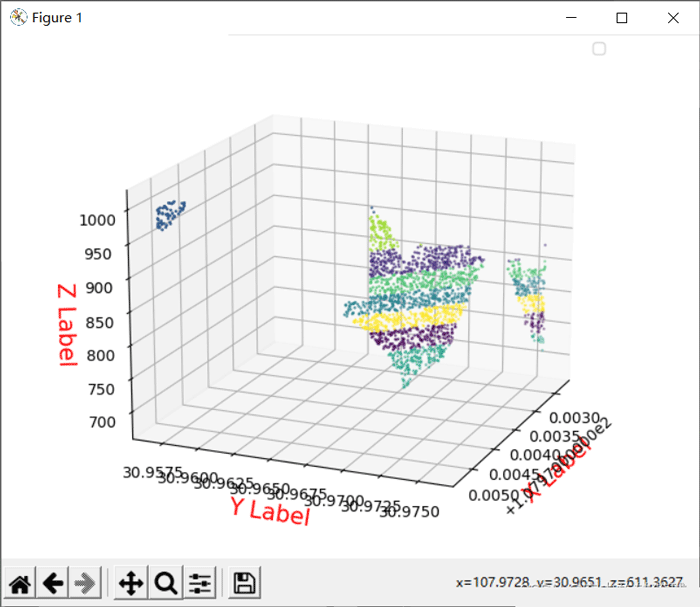
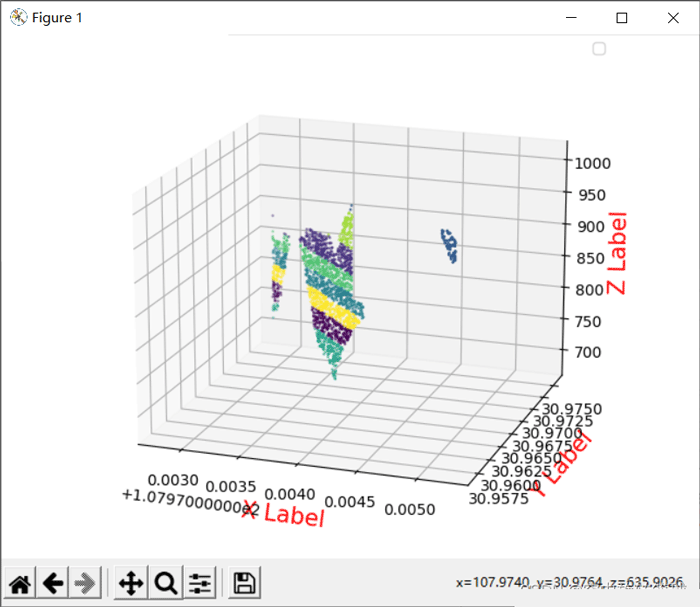
plt.show()3.1 2000行数据结果显示
由于经度在纬度方向上在17m范围类,所以立体效果较差,可以换其他数据测试。
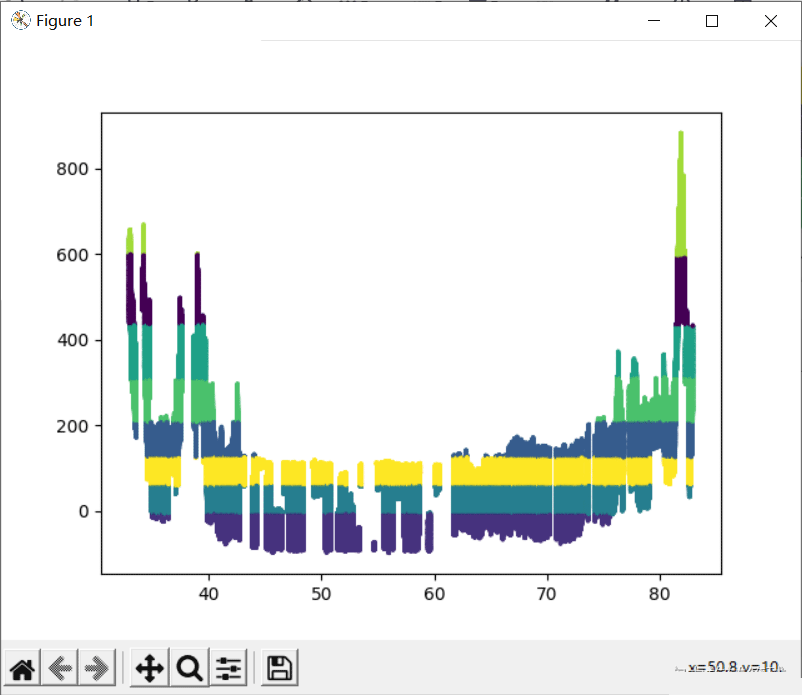
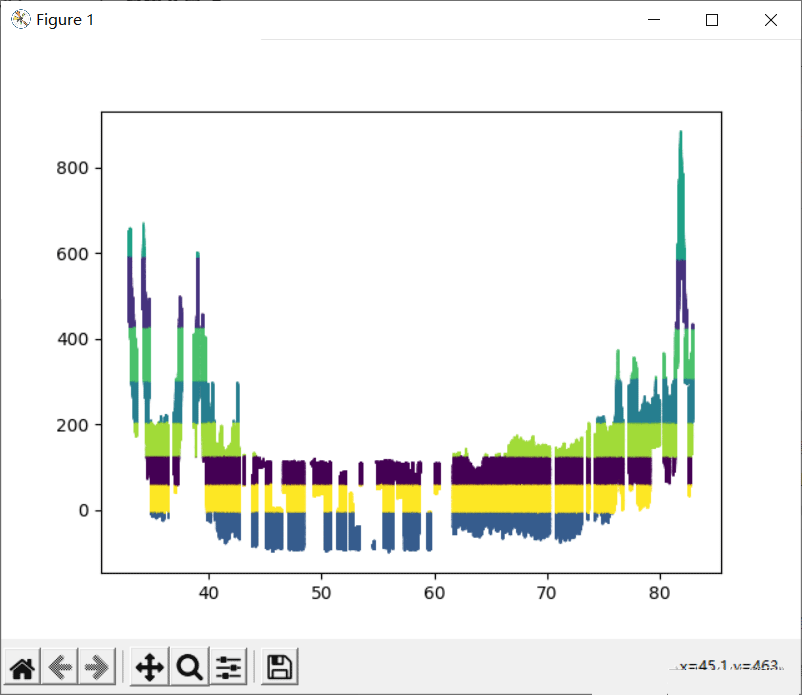
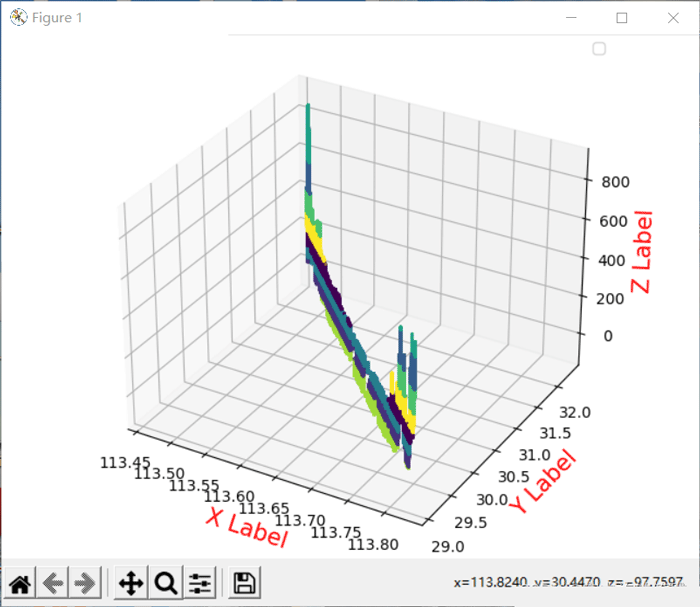
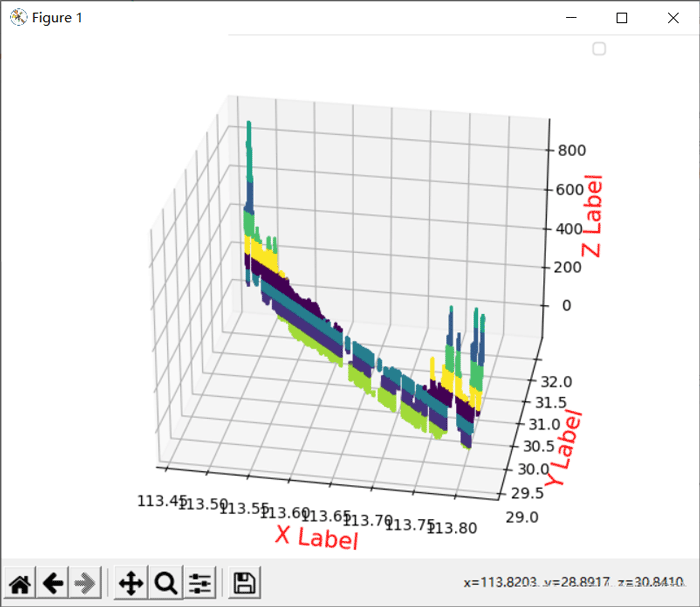
3.2 300M的CSV数据计算显示效果
105万行数据显示结果:
加载全部内容