Python双指数函数 Python应用实现双指数函数及拟合代码实例
kurrrr 人气:0双指数函数
待拟合曲线为 y(x) = bepx + ceqx
import matplotlib.pyplot as plt

x = ([0.05, 0.1, 0.15, 0.2, 0.25, 0.3, 0.35, 0.4, 0.45, 0.5,
   0.55, 0.6, 0.65, 0.7, 0.75, 0.8, 0.85, 0.9, 0.95, 1.0])
y = ([0.33, 0.26, 0.18, 0.16, 0.12, 0.09, 0.08, 0.07, 0.06, 0.06,
   0.06, 0.07, 0.09, 0.1, 0.15, 0.19, 0.25, 0.36, 0.47, 0.68])

plt.scatter(x, y)
plt.show()

拟合
import numpy as np
import matplotlib.pyplot as plt
from scipy.optimize import curve_fit


def double_exp(x, b, c, p, q):
  x = np.array(x)
  return b*np.exp(p*x) + c*np.exp(q*x)


x = ([0.05, 0.1, 0.15, 0.2, 0.25, 0.3, 0.35, 0.4, 0.45, 0.5,
   0.55, 0.6, 0.65, 0.7, 0.75, 0.8, 0.85, 0.9, 0.95, 1.0])
y = ([0.33, 0.26, 0.18, 0.16, 0.12, 0.09, 0.08, 0.07, 0.06, 0.06,
   0.06, 0.07, 0.09, 0.1, 0.15, 0.19, 0.25, 0.36, 0.47, 0.68])

popt, pcov = curve_fit(double_exp, x, y, [1, 1, 1, 1])
print(popt)

b = popt[0]
c = popt[1]
p = popt[2]
q = popt[3]

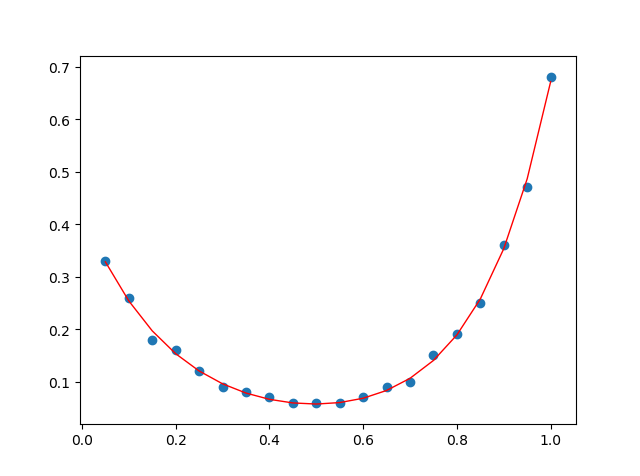
y_fit = double_exp(x, b, c, p, q)

plt.scatter(x, y)
plt.plot(x, y_fit, color='red', linewidth=1.0)

plt.show()

numpy 库,实现列表转矩阵,得以进行数学运算。matplotlib.pyplot 库,绘制图像。scipy.optimize 库,curve_fit() 函数,使用非线性最小二乘法拟合曲线。curve_fit()popt,拟合结果,在这里指b, c, p, q 的值。povc,该拟合结果对应的协方差。
拟合结果参数原函数拟合结果误差b0.00110.00110c0.42000.42420.42%p6.39986.49881.55%q-5.1551-5.21641.19%
误差可以满意。
经过测试,如果将初始参数设置为原函数参数(保留 4 位小数),拟合得到的结果并未发生变化。
经过测试,拟合使用的三种方法,"trf","lm" 和 "dogbox" 对该函数拟合结果影响微乎其微。
加载全部内容