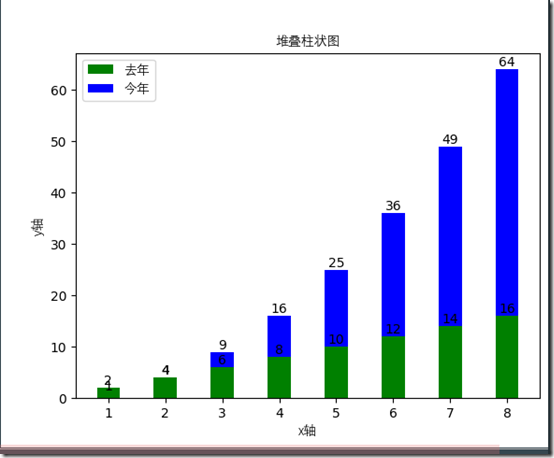
Python 堆叠柱状图绘制方法
人气:3本文介绍了Python 堆叠柱状图绘制方法,分享给大家,具体如下:

'''''''''''''''''''''''''''''''''''''''''''''''''''''''''''''''''''''''''''''''''''''''''''''''''''

>>文件: 堆叠直方图.py

>>作者: liu yang

>>邮箱: liuyang0001@outlook.com

>>博客: www.cnblogs.com/liu66blog


'''''''''''''''''''''''''''''''''''''''''''''''''''''''''''''''''''''''''''''''''''''''''''''''''''


#!/usr/bin/env python

# -*- coding: utf-8 -*-


import matplotlib.pyplot as plt

import matplotlib

# 定义要使用的字体,防止出现中文乱码

font=matplotlib.font_manager.FontProperties(fname=r"C:\Windows\Fonts\Deng.ttf")


# 双层直方图,上下结构 适用于一个柱状图全部高于另一组

def barsplot():

 # 先生成一个画布

 fig=plt.figure()

 # 生成数据

 x1=[x for x in range(1,9)]

 y1=[n*2 for n in range(1,9)]

 x2=[x for x in range(1,9)]

 y2=[x**2 for x in x2]

 # 开始画条形图2,先画数值大的,数值小的直接在原图覆盖

 l2=plt.bar(x2,y2,color='b',width=0.4)

 # 开始画条形图1

 l1=plt.bar(x1,y1,color='g',width=0.4)

 # 设置x标签

 plt.xlabel(u'x轴',fontproperties=font)

 # 设置y轴标签

 plt.ylabel('y轴',fontproperties=font)

 # 设置标题

 plt.title(u'堆叠柱状图',fontproperties=font)

 # 设置注解狂

 plt.legend(handles = [l1, l2,], labels = ['去年', '今年'], loc = 'best',prop=font)

 # 把确切数字显示出来

 for x1,x2, y1, y2 in zip(x1,x2, y1, y2):

  plt.text(x1 , y1, '%.0f' % y1, ha='center', va='bottom')

  plt.text(x2 , y2, '%.0f' % y2, ha='center', va='bottom')

 # 显示

 plt.show()


# 如果最为主模块运行

if __name__ == '__main__':

 # 实例化

 ba=barsplot()
您可能感兴趣的文章:
加载全部内容