python读取图片任意范围 python读取图片任意范围区域
sinat_34022298 人气:0使用python进行图片处理,现在需要读出图片的任意一块区域,并将其转化为一维数组,方便后续卷积操作的使用。
下面使用两种方法进行处理:
convert 函数
from PIL import Image
import numpy as np
import matplotlib.pyplot as plt

def ImageToMatrix(filename):
 im = Image.open(filename)  # 读取图片
 im.show()      # 显示图片
 width,height = im.size
 print("width is :" + str(width))
 print("height is :" + str(height))
 im = im.convert("L")    # pic --> mat 转换,可以选择不同的模式,下面有函数源码具体说明
 data = im.getdata()
 data = np.matrix(data,dtype='float')/255.0
 new_data = np.reshape(data * 255.0,(height,width))
 new_im = Image.fromarray(new_data)
 # 显示从矩阵数据得到的图片
 new_im.show()
 return new_data

def MatrixToImage(data):
 data = data*255
 new_im = Image.fromarray(data.astype(np.uint8))
 return new_im

'''
 convert(self, mode=None, matrix=None, dither=None, palette=0, colors=256)
  |  Returns a converted copy of this image. For the "P" mode, this
  |  method translates pixels through the palette. If mode is
  |  omitted, a mode is chosen so that all information in the image
  |  and the palette can be represented without a palette.
  |
  |  The current version supports all possible conversions between
  |  "L", "RGB" and "CMYK." The **matrix** argument only supports "L"
  |  and "RGB".
  |
  |  When translating a color image to black and white (mode "L"),
  |  the library uses the ITU-R 601-2 luma transform::
  |
  |   L = R * 299/1000 + G * 587/1000 + B * 114/1000
  |
  |  The default method of converting a greyscale ("L") or "RGB"
  |  image into a bilevel (mode "1") image uses Floyd-Steinberg
  |  dither to approximate the original image luminosity levels. If
  |  dither is NONE, all non-zero values are set to 255 (white). To
  |  use other thresholds, use the :py:meth:`~PIL.Image.Image.point`
  |  method.
  |
  |  :param mode: The requested mode. See: :ref:`concept-modes`.
  |  :param matrix: An optional conversion matrix. If given, this
  |   should be 4- or 12-tuple containing floating point values.
  |  :param dither: Dithering method, used when converting from
  |   mode "RGB" to "P" or from "RGB" or "L" to "1".
  |   Available methods are NONE or FLOYDSTEINBERG (default).
  |  :param palette: Palette to use when converting from mode "RGB"
  |   to "P". Available palettes are WEB or ADAPTIVE.
  |  :param colors: Number of colors to use for the ADAPTIVE palette.
  |   Defaults to 256.
  |  :rtype: :py:class:`~PIL.Image.Image`
  |  :returns: An :py:class:`~PIL.Image.Image` object.

'''
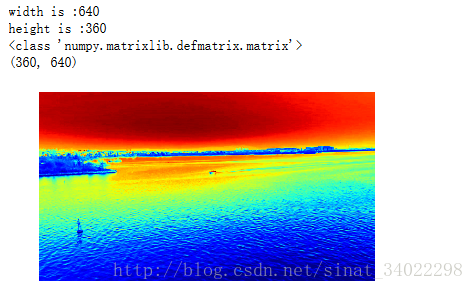
原图:

filepath = "./imgs/"

imgdata = ImageToMatrix("./imgs/0001.jpg")
print(type(imgdata))
print(imgdata.shape)

plt.imshow(imgdata) # 显示图片
plt.axis('off')  # 不显示坐标轴
plt.show()
运行结果:

mpimg 函数
import matplotlib.pyplot as plt  # plt 用于显示图片
import matplotlib.image as mpimg  # mpimg 用于读取图片
import numpy as np

def readPic(picname, filename):
 img = mpimg.imread(picname)
 # 此时 img 就已经是一个 np.array 了,可以对它进行任意处理
 weight,height,n = img.shape  #(512, 512, 3)
 print("the original pic: \n" + str(img))

 plt.imshow(img)     # 显示图片
 plt.axis('off')     # 不显示坐标轴
 plt.show()

 # 取reshape后的矩阵的第一维度数据,即所需要的数据列表
  img_reshape = img.reshape(1,weight*height*n)[0]
  print("the 1-d image data :\n "+str(img_reshape))

 # 截取(300,300)区域的一小块(12*12*3),将该区域的图像数据转换为一维数组
 img_cov = np.random.randint(1,2,(12,12,3))  # 这里使用np.ones()初始化数组,会出现数组元素为float类型,使用np.random.randint确保其为int型
 for j in range(12):
  for i in range(12):
   img_cov[i][j] = img[300+i][300+j]

 img_reshape = img_cov.reshape(1,12*12*3)[0]
 print((img_cov))
 print(img_reshape)

 # 打印该12*12*3区域的图像
 plt.imshow(img_cov)
 plt.axis('off')
 plt.show()

 # 写文件
 # open:以append方式打开文件,如果没找到对应的文件,则创建该名称的文件
 with open(filename, 'a') as f:
  f.write(str(img_reshape))
 return img_reshape

if __name__ == '__main__':
 picname = './imgs/0001.jpg'
 readPic(picname, "data.py")
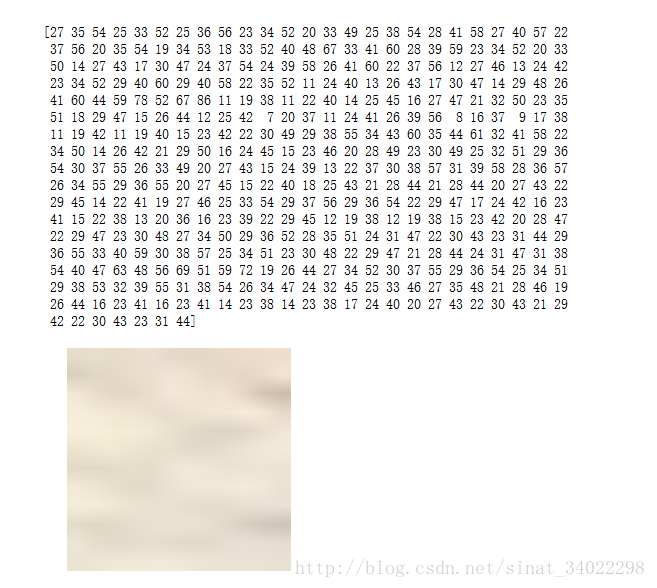
读出的数据(12*12*3),每个像素点以R、G、B的顺序排列,以及该区域显示为图片的效果:

加载全部内容