python 一维线性回归 python 还原梯度下降算法实现一维线性回归
Mchael菜鸟 人气:0想了解python 还原梯度下降算法实现一维线性回归的相关内容吗,Mchael菜鸟在本文为您仔细讲解python 一维线性回归 的相关知识和一些Code实例,欢迎阅读和指正,我们先划重点:python,一维线性回归,python,线性回归,下面大家一起来学习吧。
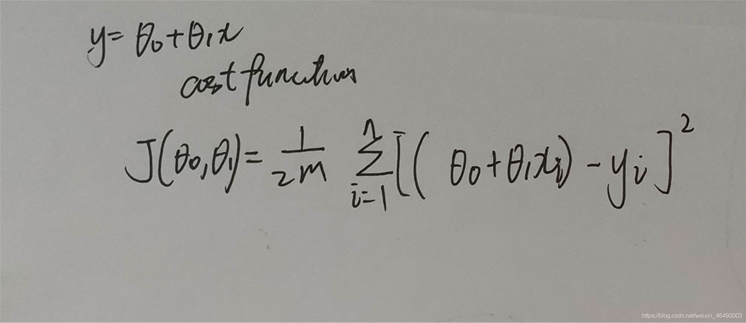
首先我们看公式:

这个是要拟合的函数
然后我们求出它的损失函数, 注意:这里的n和m均为数据集的长度,写的时候忘了

注意,前面的theta0-theta1x是实际值,后面的y是期望值
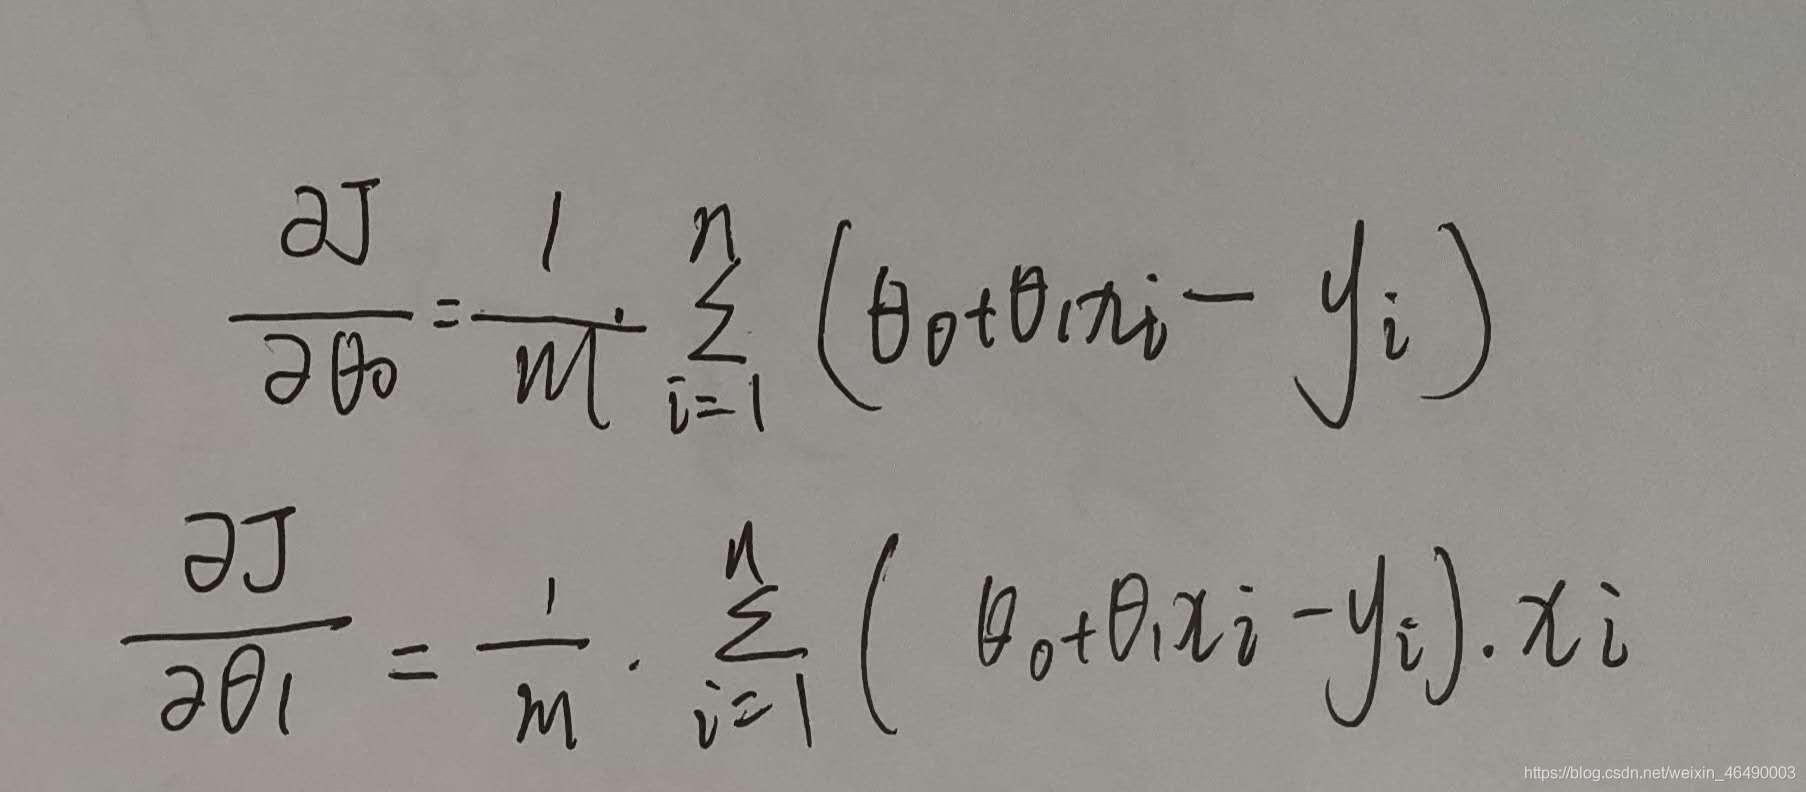
接着我们求出损失函数的偏导数:

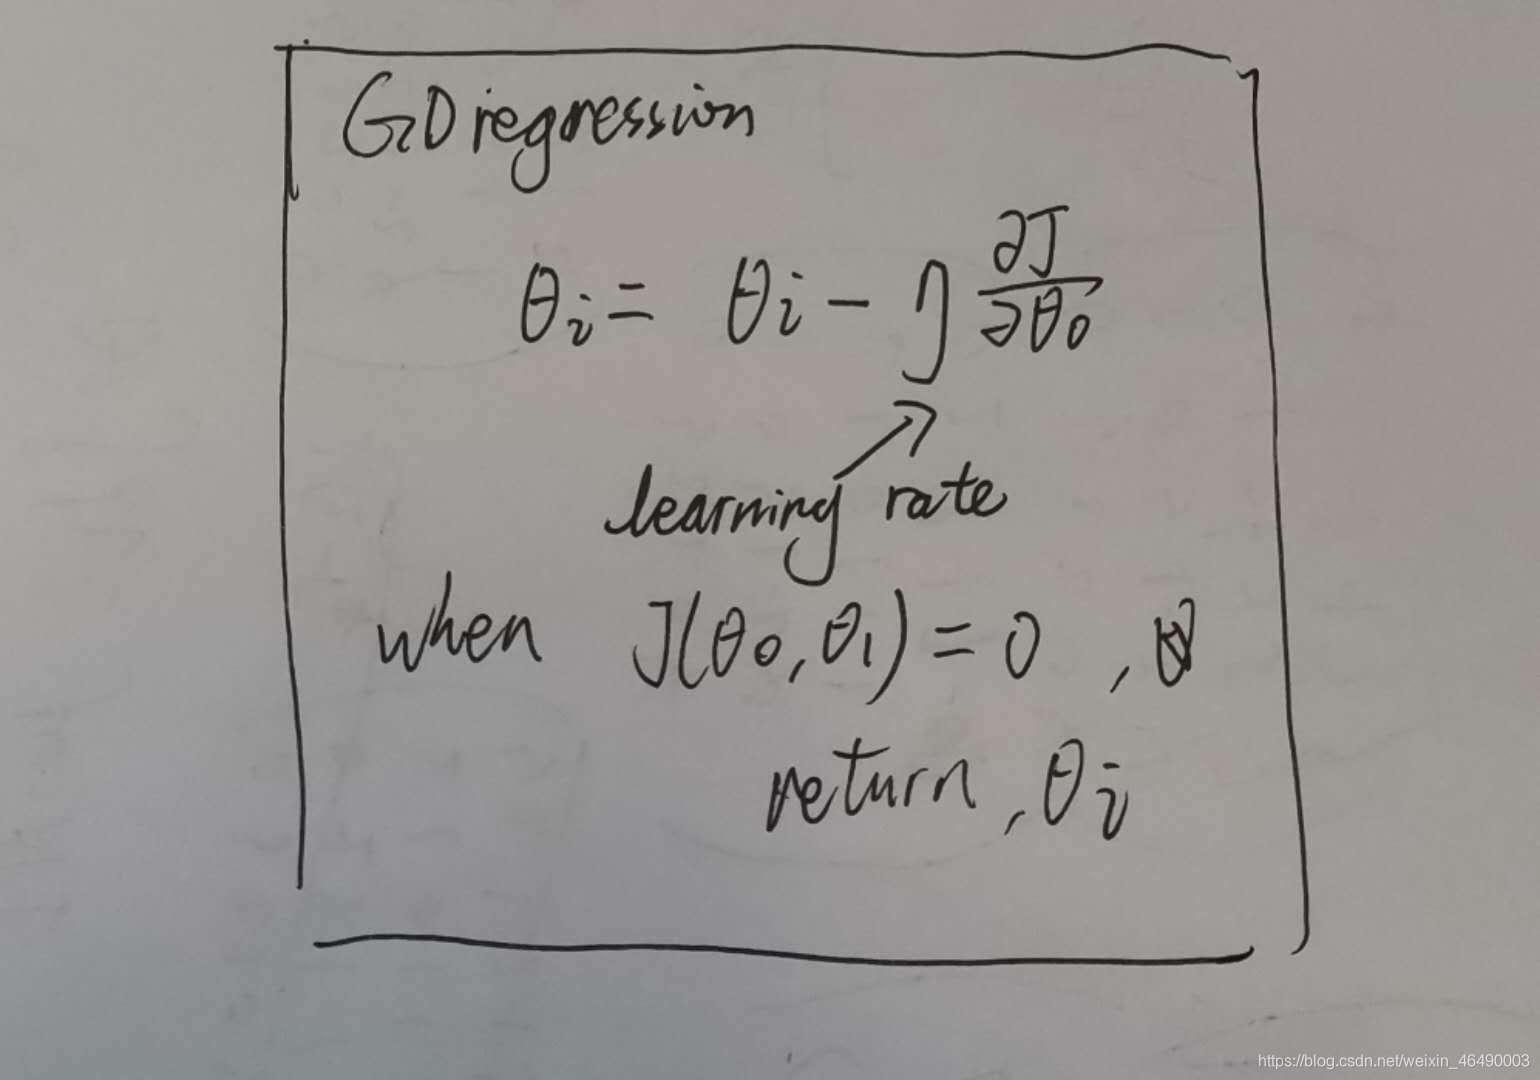
最终,梯度下降的算法:

学习率一般小于1,当损失函数是0时,我们输出theta0和theta1.
接下来上代码!
class LinearRegression():

  def __init__(self, data, theta0, theta1, learning_rate):
    self.data = data
    self.theta0 = theta0
    self.theta1 = theta1
    self.learning_rate = learning_rate
    self.length = len(data)

  # hypothesis
  def h_theta(self, x):
    return self.theta0 + self.theta1 * x

  # cost function
  def J(self):
    temp = 0
    for i in range(self.length):
      temp += pow(self.h_theta(self.data[i][0]) - self.data[i][1], 2)
    return 1 / (2 * self.m) * temp

  # partial derivative
  def pd_theta0_J(self):
    temp = 0
    for i in range(self.length):
      temp += self.h_theta(self.data[i][0]) - self.data[i][1]
    return 1 / self.m * temp

  def pd_theta1_J(self):
    temp = 0
    for i in range(self.length):
      temp += (self.h_theta(data[i][0]) - self.data[i][1]) * self.data[i][0]
    return 1 / self.m * temp

  # gradient descent
  def gd(self):
    min_cost = 0.00001
    round = 1
    max_round = 10000
    while min_cost < abs(self.J()) and round <= max_round:
      self.theta0 = self.theta0 - self.learning_rate * self.pd_theta0_J()
      self.theta1 = self.theta1 - self.learning_rate * self.pd_theta1_J()

      print('round', round, ':\t theta0=%.16f' % self.theta0, '\t theta1=%.16f' % self.theta1)
      round += 1
    return self.theta0, self.theta1

def main():
	data = [[1, 2], [2, 5], [4, 8], [5, 9], [8, 15]] # 这里换成你想拟合的数[x, y]
	 # plot scatter
  x = []
  y = []
  for i in range(len(data)):
    x.append(data[i][0])
    y.append(data[i][1])
  plt.scatter(x, y)

  # gradient descent
  linear_regression = LinearRegression(data, theta0, theta1, learning_rate)
  theta0, theta1 = linear_regression.gd()

  # plot returned linear
  x = np.arange(0, 10, 0.01)
  y = theta0 + theta1 * x
  plt.plot(x, y)
  plt.show()
加载全部内容