matplotlib 梯度下降 浅谈matplotlib 绘制梯度下降求解过程
Michael阿明 人气:0机器学习过程中经常需要可视化,有助于加强对模型和参数的理解。
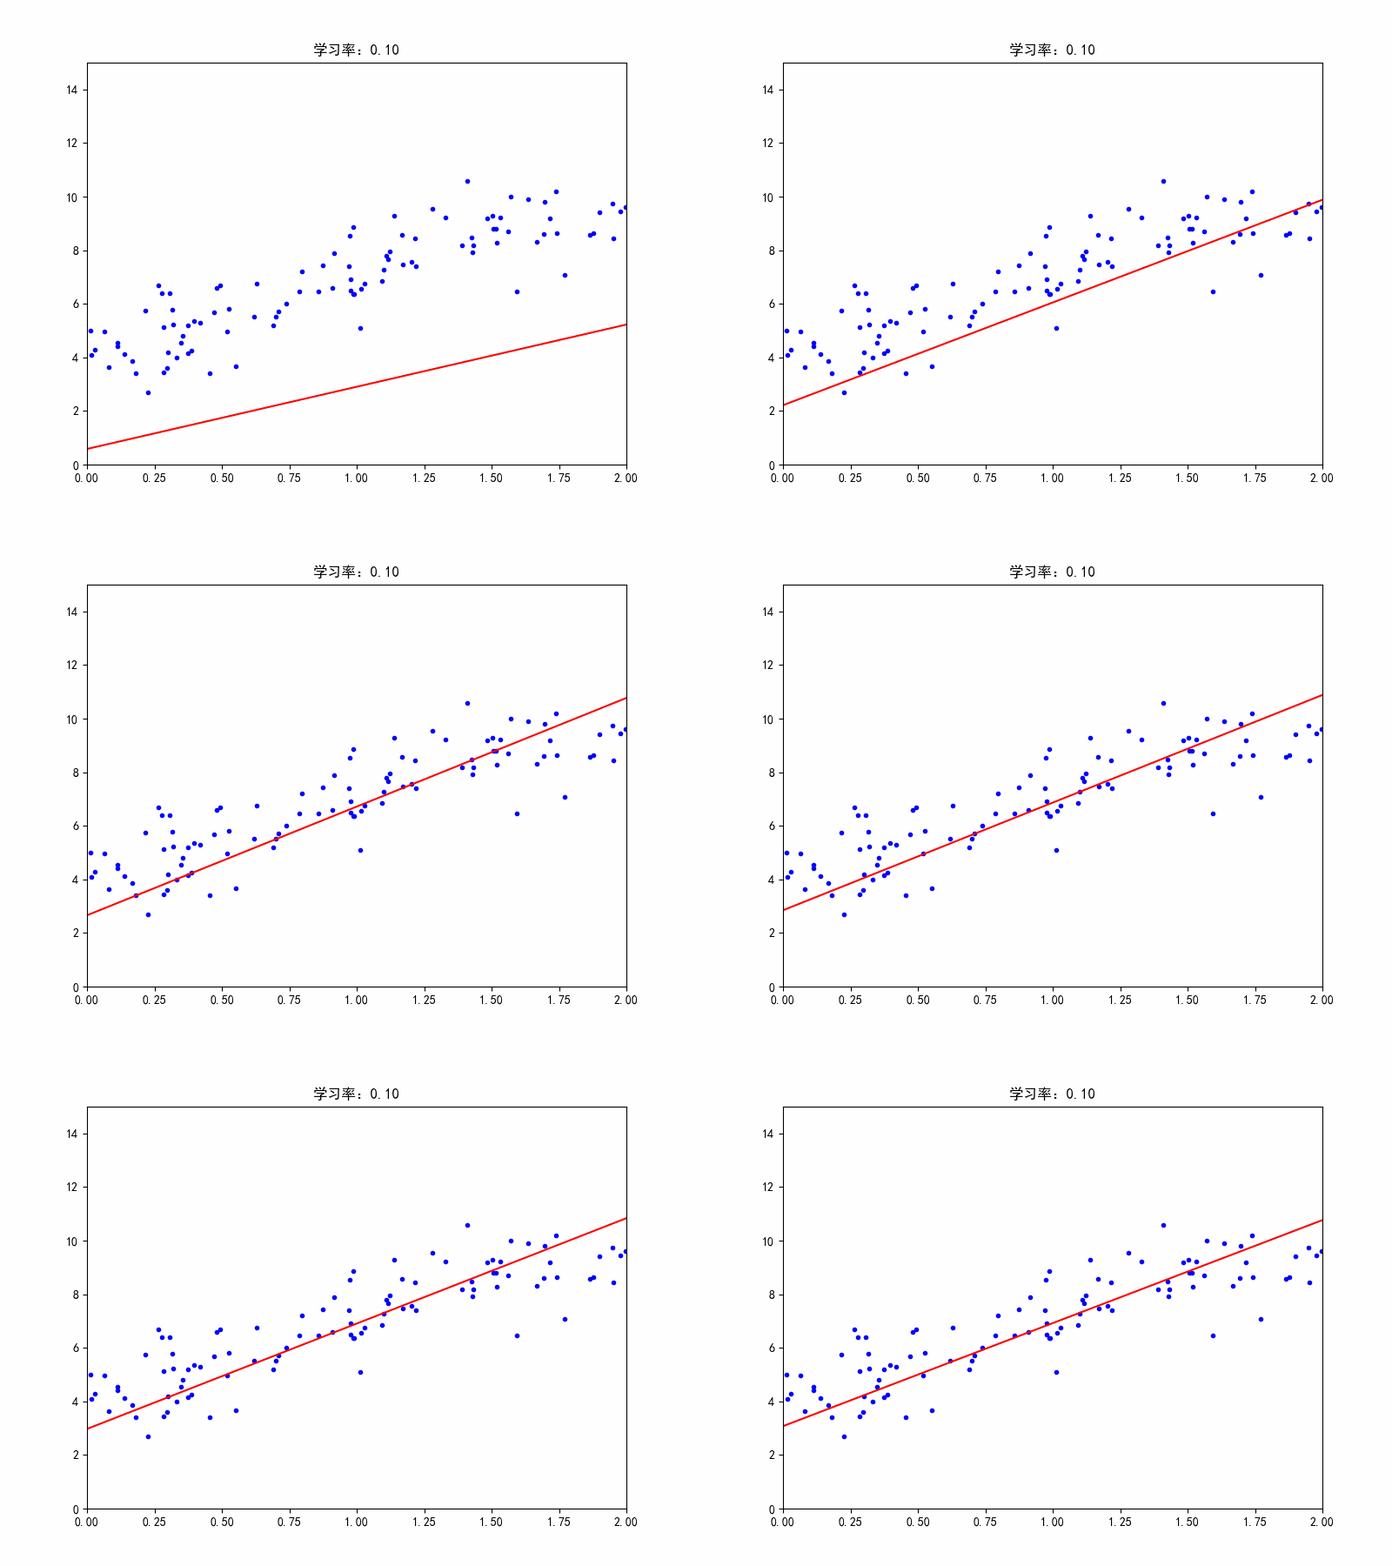
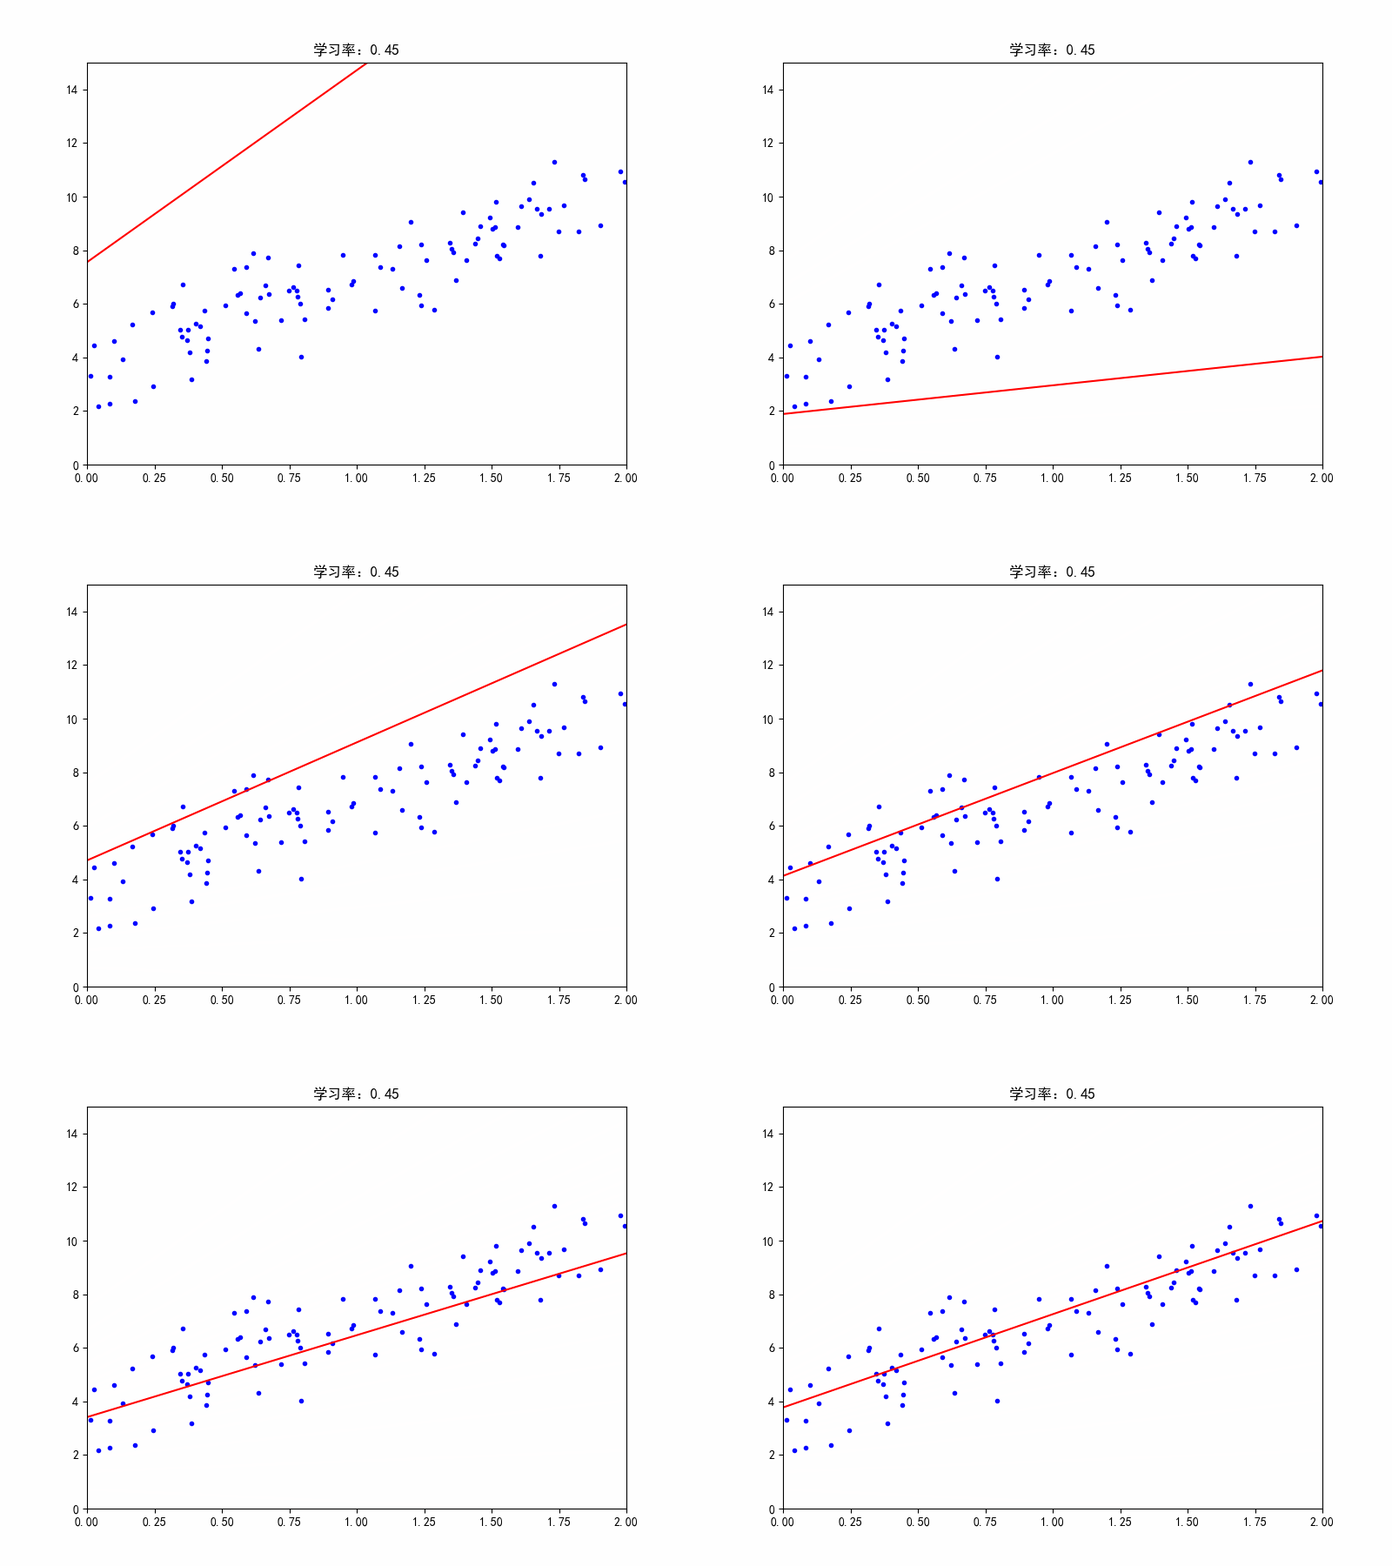
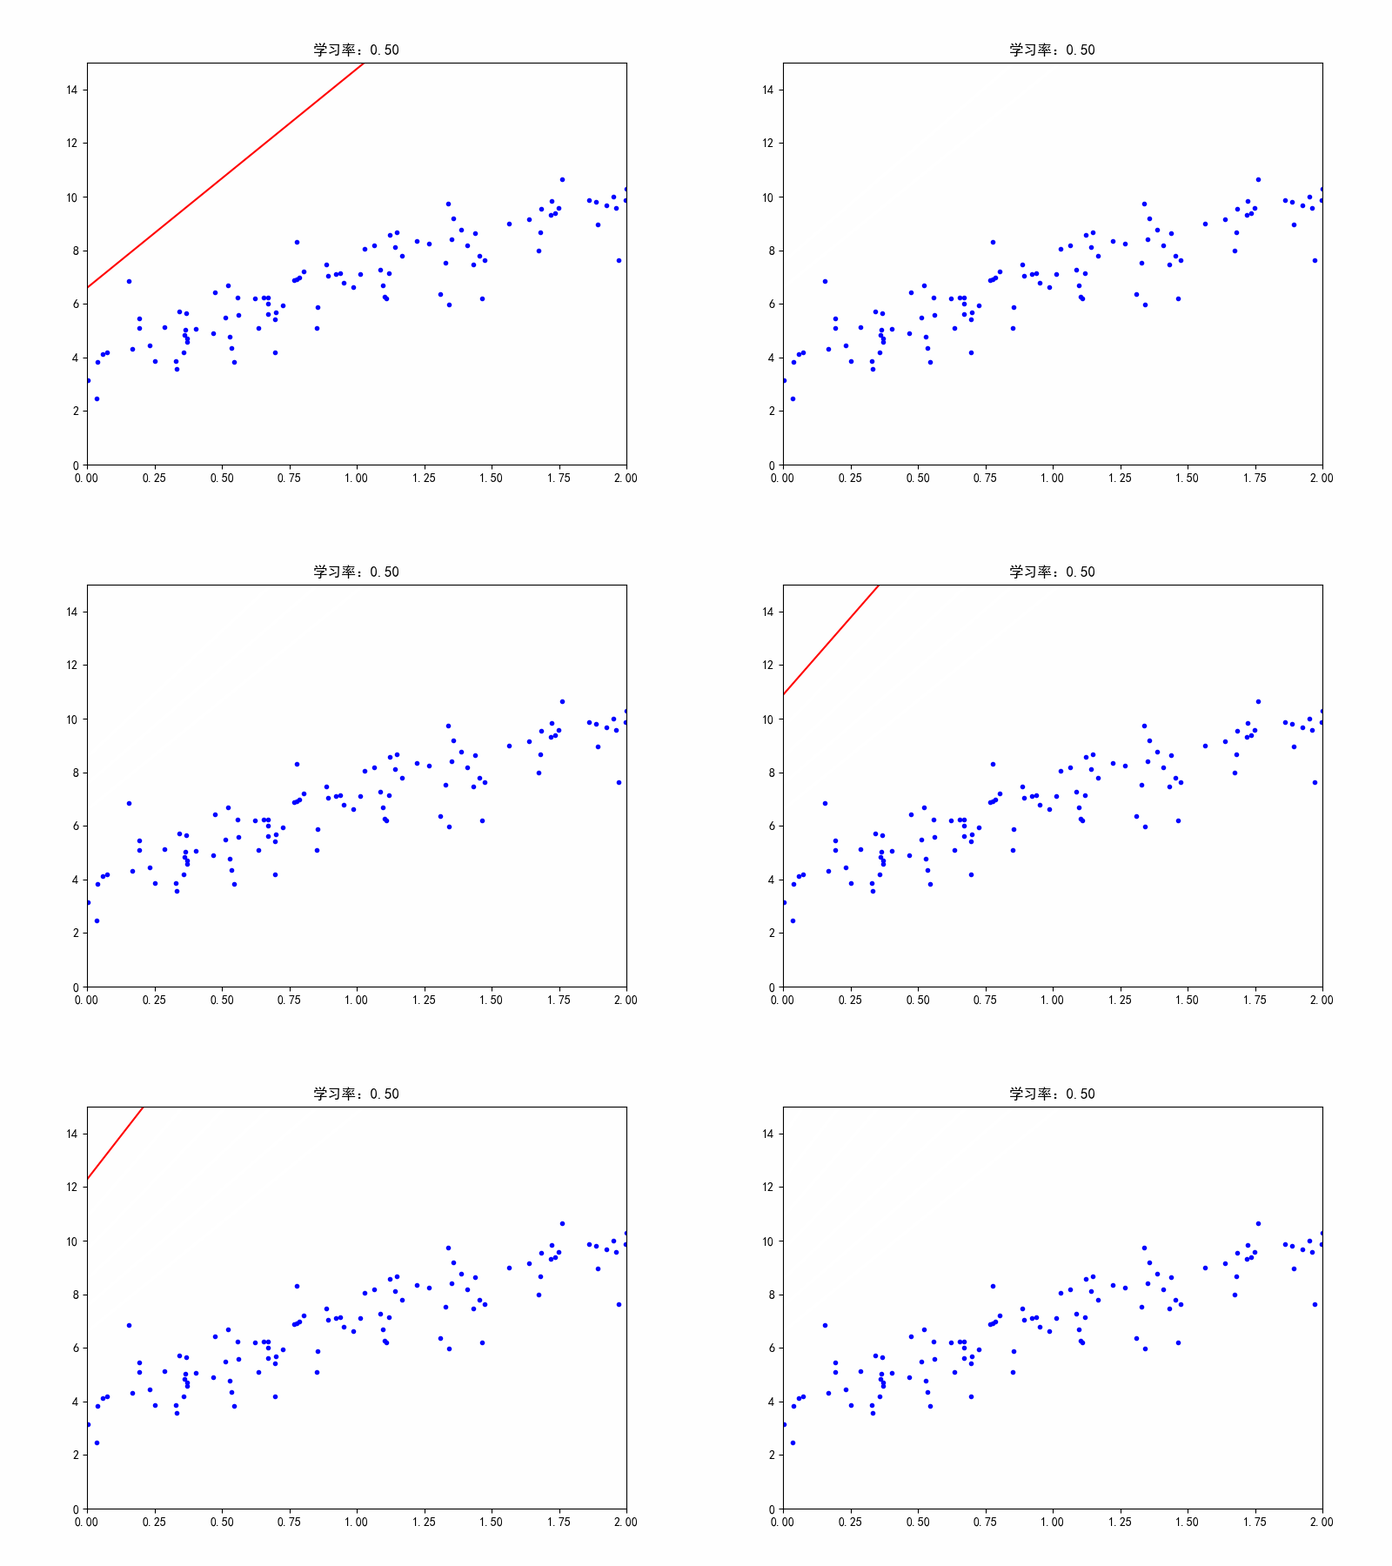
下面对梯度下降过程进行动图演示,可以修改不同的学习率,观看效果。
import numpy as np
import matplotlib.pyplot as plt
from IPython import display

X = 2*np.random.rand(100,1)
y = 4+3*X+np.random.randn(100,1) # randn正态分布
X_b = np.c_[np.ones((100,1)),X] # c_行数相等,左右拼接

eta = 0.1 # 学习率
n_iter = 1000 # 迭代次数
m = 100 # 样本点个数
theta = np.random.randn(2,1) # 参数初始值

plt.figure(figsize=(8,6))
mngr = plt.get_current_fig_manager() # 获取当前figure manager
mngr.window.wm_geometry("+520+520") # 调整窗口在屏幕上弹出的位置,注意写在打开交互模式之前
# 上面固定窗口,方便screentogif定位录制,只会这种弱弱的方法
plt.ion()# 打开交互模式
plt.rcParams["font.sans-serif"] = "SimHei"# 消除中文乱码

for iter in range(n_iter):
  plt.cla() # 清除原图像

  gradients = 2/m*X_b.T.dot(X_b.dot(theta)-y)
  theta = theta - eta*gradients
  X_new = np.array([[0],[2]])
  X_new_b = np.c_[np.ones((2,1)),X_new]
  y_pred = X_new_b.dot(theta)

  plt.axis([0,2,0,15])
  plt.plot(X,y,"b.")
  plt.plot(X_new,y_pred,"r-")
  plt.title("学习率:{:.2f}".format(eta))
  plt.pause(0.3) # 暂停一会
  display.clear_output(wait=True)# 刷新图像


plt.ioff()# 关闭交互模式
plt.show()

学习率:0.1,较合适

学习率:0.02,收敛变慢了

学习率:0.45,在最佳参数附近震荡

学习率:0.5,不收敛
加载全部内容