D3.js实现饼状图的方法详解
人气:0前言
小编在之前已经跟大家分享过关于怎样用柱状图和折线图这两种基本图表。这两种图表都是有坐标轴的,现在来说一种没有坐标轴的图表——饼图。
饼状图实现
还是和之前一样,我们先把简单的画图框架搭起来,添加SVG画布。但是这里需要注意的是,为了方便后面画饼图上的弧形,我们把组合这些元素的g元素移动到画布的中心:
<!DOCTYPE html>
<html lang="en">
 <head>
 <meta charset="UTF-8">
 <title>饼图</title>
 <style>
  .container {
  margin: 30px auto;
  width: 600px;
  height: 300px;
  border: 1px solid #000;
  }
 </style>
 </head>
 <body>
 <div class="container">
  <svg width="100%" height="100%"></svg>
 </div>
 <script src="http:/https://img.qb5200.com/download-x/d3js.orghttps://img.qb5200.com/download-x/d3.v3.min.js" charset="utf-8"></script>
 <script>
  window.onload = function() {
  var width = 600, height = 300;
  // 创建一个分组用来组合要画的图表元素
  var main = d3.select('.container svg').append('g')
   .classed('main', true)
   // 注意这里和前面几种图表的差别
   .attr('transform', "translate(" + width/2 + ',' + height/2 + ')');

  };
 </script>
 </body>
</html>
模拟数据并转化
为了画饼图,我们模拟了一些这样的数据。
// 模拟数据
var dataset = [
 {name: '购物', value: 983},
 {name: '日常饮食', value: 300},
 {name: '医药', value: 1400},
 {name: '交通', value: 402},
 {name: '杂费', value: 134}
];
在柱状图等有坐标轴的图表中,我们通过创建合适的比例尺来将模拟好的数据转化成适合画图的数据,那在饼图里,又用什么来转化呢?看这里~
// 转换原始数据为能用于绘图的数据
var pie = d3.layout.pie()
  .sort(null)
  .value(function(d) {
   return d.value;
  });
// pie是一个函数
var pieData = pie(dataset);
layout叫做布局,在D3.js中它提供了一些转化成特定图表数据的函数,如其中就包括饼图。它提供一个基础的转化函数,在此基础上我们根据自己的需要再对该函数进行进一步的设置,就得到了如上述代码中pie变量保存的函数一样的转化工具,通过把原始的数据dataset传入pie中就能得到绘图数据pieData。
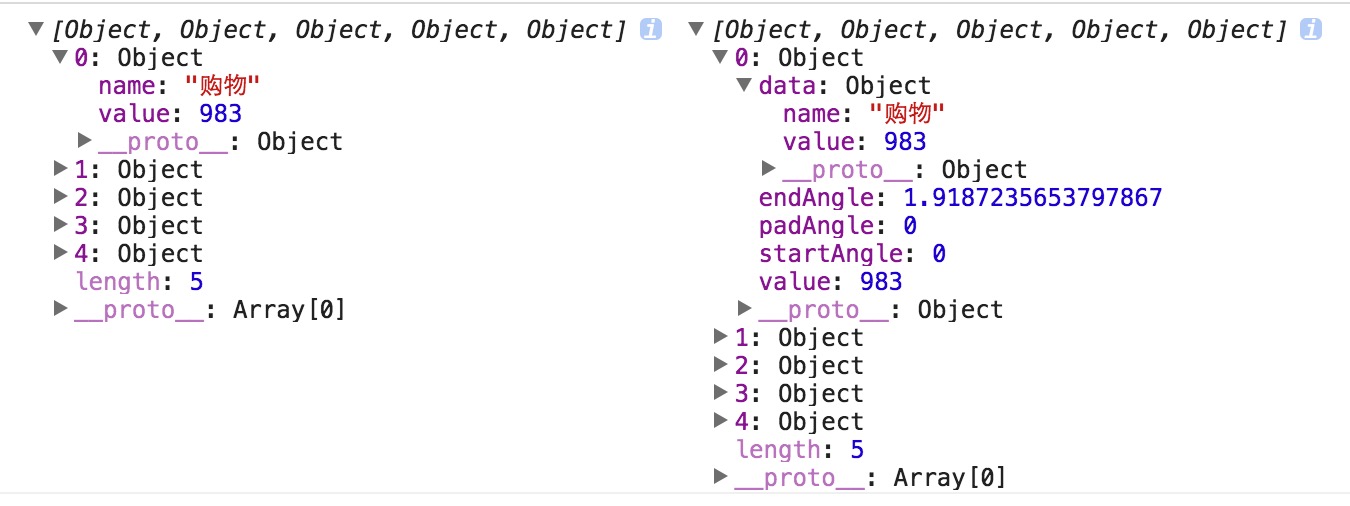
具体的变化我们可以看下图。

左边是转化前的原始的数据结构,右边是转化后的适合绘图的数据结构。可以看到,在保留原本的数据的基础上,转化后的数据新增了该项在整个饼图中的起始角度(startAngle和endAngle),以及弧形之间的间隙角度(padAngle)。
计算弧形路径
在饼图中,我们用SVG中的path元素来表示每一块弧形,而从pieData到path元素的d属性还是有一定的距离,所以我还需要再通过一步操作来用pieData计算出d属性可用的值。
// 创建计算弧形路径的函数
var radius = 100;
var arc = d3.svg.arc()
 .innerRadius(0)
 .outerRadius(radius);
添加弧形
上面的代码用svg.arc()创建了一个计算弧形路径的函数,通过这个函数就可以计算出path的d属性的值,就像下面这样。
// 添加弧形
main.selectAll('g')
 .data(pieData)
 .enter()
 .append('path')
 .attr('fill', function(d, i) {
  return getColor(i);
 })
 .attr('d', function(d){
  return arc(d);
 });
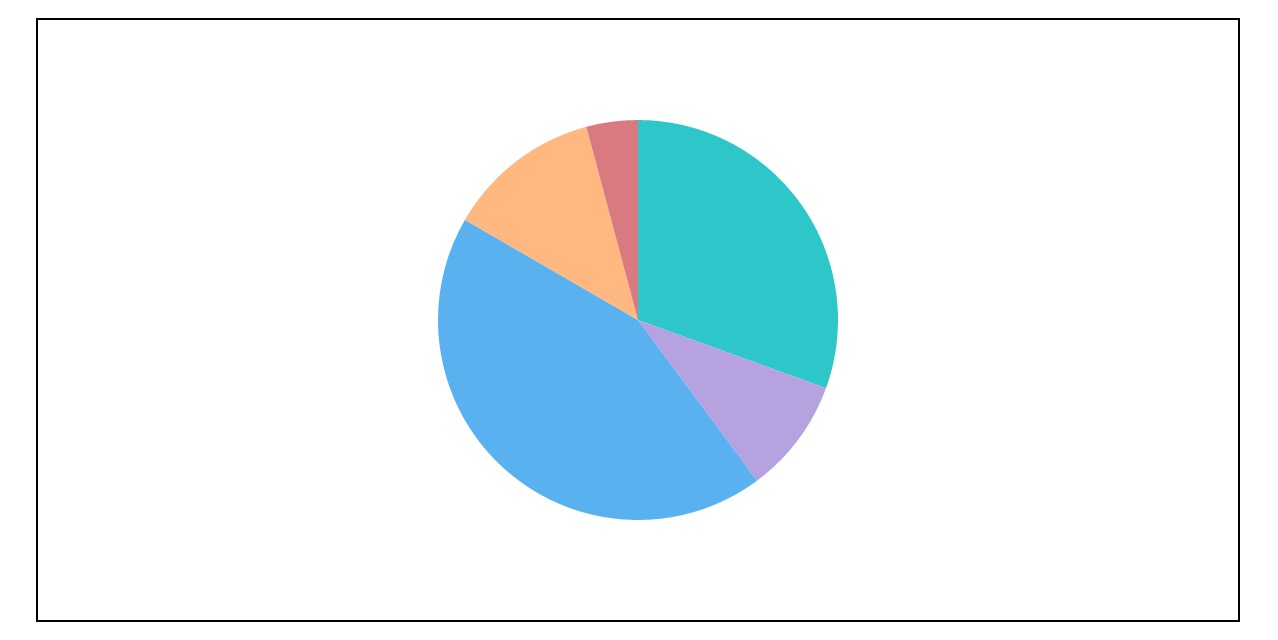
好了,饼图就这样画好了。

下面给大家分享个实例代码,实现饼图中加上下图这样的文字标签。
效果图

实例代码
<!DOCTYPE html>
<html lang="en">
 <head>
 <meta charset="UTF-8">
 <title>饼图</title>
 <style>
  .container {
  margin: 30px auto;
  width: 600px;
  height: 300px;
  border: 1px solid #000;
  }
  polyline {
  fill: none;
  stroke: #000000;
  stroke-width: 2px;
  stroke-dasharray: 5px;
  }
 </style>
 </head>
 <body>
 <div class="container">
  <svg width="100%" height="100%"></svg>
 </div>
 <script src="http:/https://img.qb5200.com/download-x/d3js.orghttps://img.qb5200.com/download-x/d3.v3.min.js" charset="utf-8"></script>
 <script>
  window.onload = function() {
  var width = 600, height = 300;
  // 创建一个分组用来组合要画的图表元素
  var main = d3.select('.container svg').append('g')
   .classed('main', true)
   .attr('transform', "translate(" + width/2 + ',' + height/2 + ')');
  // 模拟数据
  var dataset = [
   {name: '购物', value: 983},
   {name: '日常饮食', value: 300},
   {name: '医药', value: 1400},
   {name: '交通', value: 402},
   {name: '杂费', value: 134}
  ];
  // 转换原始数据为能用于绘图的数据
  var pie = d3.layout.pie()
   .sort(null)
   .value(function(d) {
    return d.value;
   });
  // pie是一个函数
  var pieData = pie(dataset);
  // 创建计算弧形路径的函数
  var radius = 100;
  var arc = d3.svg.arc()
   .innerRadius(0)
   .outerRadius(radius);
  var outerArc = d3.svg.arc()
   .innerRadius(1.2 * radius)
   .outerRadius(1.2 * radius);
  var oArc = d3.svg.arc()
   .innerRadius(1.1 * radius)
   .outerRadius(1.1 * radius);
  var slices = main.append('g').attr('class', 'slices');
  var lines = main.append('g').attr('class', 'lines');
  var labels = main.append('g').attr('class', 'labels');
  // 添加弧形元素(g中的path)
  var arcs = slices.selectAll('g')
   .data(pieData)
   .enter()
   .append('path')
   .attr('fill', function(d, i) {
    return getColor(i);
   })
   .attr('d', function(d){
    return arc(d);
   });
  // 添加文字标签
  var texts = labels.selectAll('text')
   .data(pieData)
   .enter()
   .append('text')
   .attr('dy', '0.35em')
   .attr('fill', function(d, i) {
    return getColor(i);
   })
   .text(function(d, i) {
    return d.data.name;
   })
   .style('text-anchor', function(d, i) {
    return midAngel(d)<Math.PI ? 'start' : 'end';
   })
   .attr('transform', function(d, i) {
    // 找出外弧形的中心点
    var pos = outerArc.centroid(d);
    // 改变文字标识的x坐标
    pos[0] = radius * (midAngel(d)<Math.PI ? 1.5 : -1.5);

    return 'translate(' + pos + ')';
   })
   .style('opacity', 1);

  var polylines = lines.selectAll('polyline')
   .data(pieData)
   .enter()
   .append('polyline')
   .attr('points', function(d) {
    return [arc.centroid(d), arc.centroid(d), arc.centroid(d)];
   })
   .attr('points', function(d) {
    var pos = outerArc.centroid(d);
    pos[0] = radius * (midAngel(d)<Math.PI ? 1.5 : -1.5);
    return [oArc.centroid(d), outerArc.centroid(d), pos];
   })
   .style('opacity', 0.5);
  };
  function midAngel(d) {
  return d.startAngle + (d.endAngle - d.startAngle)/2;
  }
  function getColor(idx) {
  var palette = [
   '#2ec7c9', '#b6a2de', '#5ab1ef', '#ffb980', '#d87a80',
   '#8d98b3', '#e5cf0d', '#97b552', '#95706d', '#dc69aa',
   '#07a2a4', '#9a7fd1', '#588dd5', '#f5994e', '#c05050',
   '#59678c', '#c9ab00', '#7eb00a', '#6f5553', '#c14089'
  ]
  return palette[idx % palette.length];
  }
 </script>
 </body>
</html>
总结
以上就是利用D3.js实现饼图的全部内容,希望这篇文章对大家的学习和工作能有所帮助。如果有疑问大家可以留言交流,小编还会陆续更新关于D3.js的文章,请大家继续关注。
加载全部内容