Python pyecharts
王小王_123 人气:0前言
相信有很多的小伙伴看了如此多个案例之后肯定有所发现,每一个案例都对应着每一个配置,如果是官方配置文档,说实话看起来真的很难,这样通过案例实现来解决各种参数的配置,我觉得有一定的参考价值和学习意义,正所谓“磨刀不误砍工”,如何把可视化做的炉火纯青,任重而道远也!
说明:有些数据是调用相关库资源:from pyecharts.faker import Faker,需要自己添加数据,非常简单,这个不用担心。
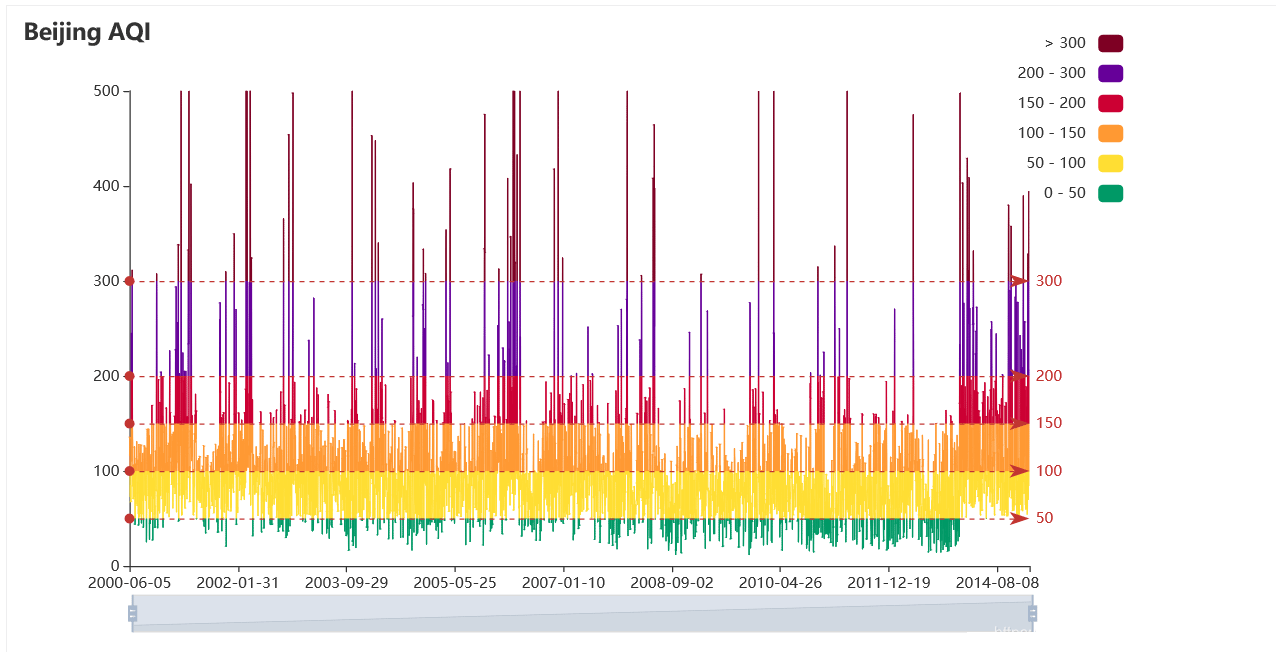
你觉得上述图形用的上吗,我估计在平时的小场景可能用不到,但是做股票好像不错哟!
折线图模板系列
自定义标签数据折线图
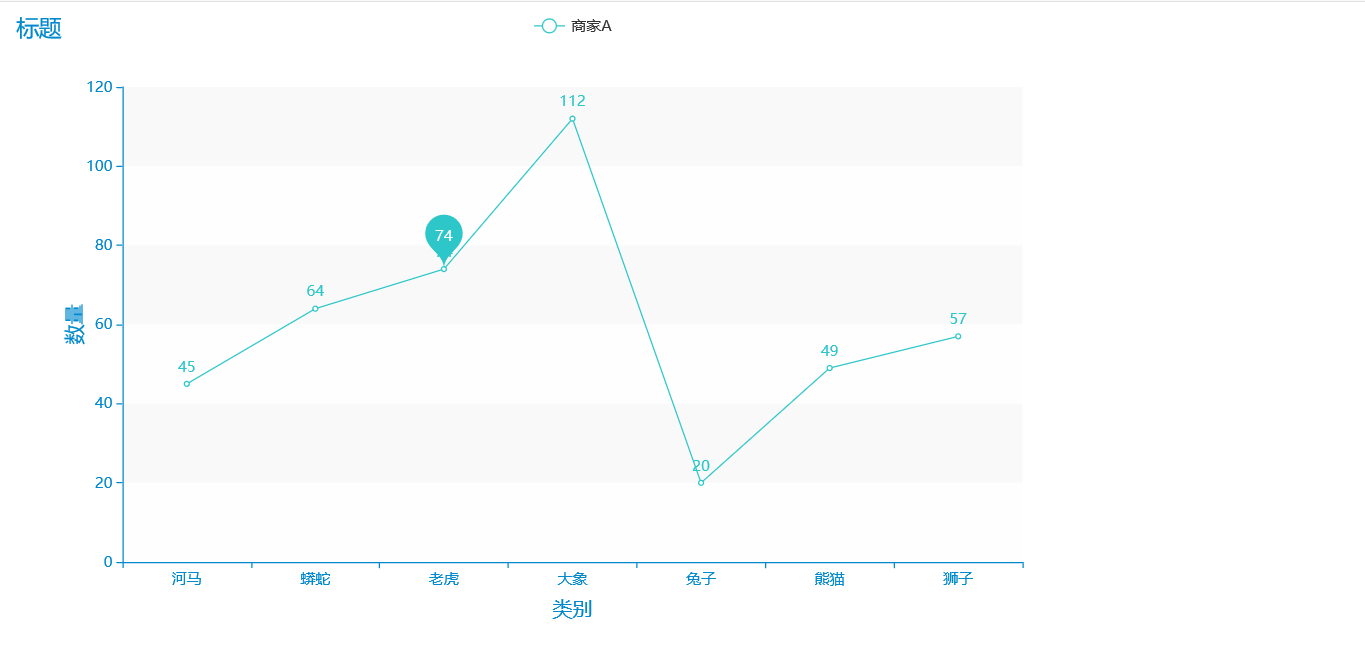
有时候我们不想要把所有的数据标签都显示出来,因为这样太繁杂了,数据可视化的原则就是在炫酷的同时把图表准确的呈现在用户的面前,这就需要我们按照特定的场景选择特定的图形。
import pyecharts.options as opts
from pyecharts.charts import Line
from pyecharts.faker import Faker
from pyecharts.globals import ThemeType

x, y = Faker.choose(), Faker.values()#更改数据集即可
c = (
Line({"theme":ThemeType.MACARONS})#不添加默认红色
.add_xaxis(x)
.add_yaxis(
"商家A",
y,
markpoint_opts=opts.MarkPointOpts(
data=[opts.MarkPointItem(name="自定义标记点", coord=[x[2], y[2]], value=y[2])] # 这里定义要显示的标签数据
),
)
.set_global_opts(title_opts=opts.TitleOpts(title="标题"),
xaxis_opts=opts.AxisOpts(
name='类别',
name_location='middle',
name_gap=30, # 标签与轴线之间的距离,默认为20,最好不要设置20
name_textstyle_opts=opts.TextStyleOpts(
font_family='Times New Roman',
font_size=16 # 标签字体大小
)),
yaxis_opts=opts.AxisOpts(
name='数量',
name_location='middle',
name_gap=30,
name_textstyle_opts=opts.TextStyleOpts(
font_family='Times New Roman',
font_size=16
# font_weight='bolder',
)),
# toolbox_opts=opts.ToolboxOpts() # 工具选项
)
.render("自定义标签.html")
)
一天用电量折线图(特定场景)
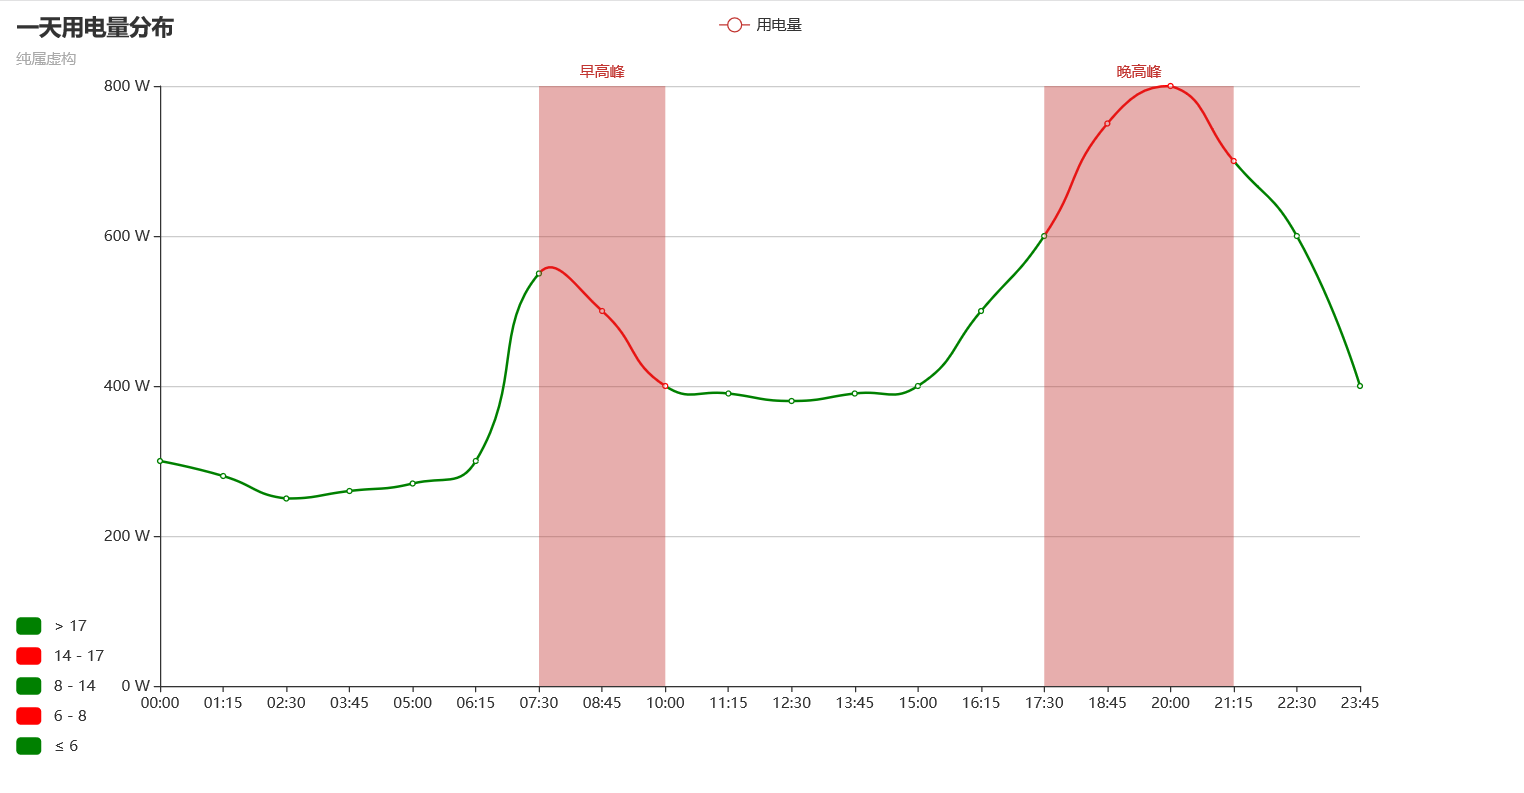
此模板可以作为一天用电量的应用,也可以在此基础上进行更改,形成其他类别的折线图,只是提供模板,你可以根据自己的应用场景来解决问题。
import pyecharts.options as opts
from pyecharts.charts import Line
x_data = [
"00:00",
"01:15",
"02:30",
"03:45",
"05:00",
"06:15",
"07:30",
"08:45",
"10:00",
"11:15",
"12:30",
"13:45",
"15:00",
"16:15",
"17:30",
"18:45",
"20:00",
"21:15",
"22:30",
"23:45",
]
y_data = [
300,
280,
250,
260,
270,
300,
550,
500,
400,
390,
380,
390,
400,
500,
600,
750,
800,
700,
600,
400,
]

(
Line(init_opts=opts.InitOpts(width="1200px", height="600px"))
.add_xaxis(xaxis_data=x_data)
.add_yaxis(
series_name="用电量",
y_axis=y_data,
is_smooth=True,
label_opts=opts.LabelOpts(is_show=False),
linestyle_opts=opts.LineStyleOpts(width=2),
)
.set_global_opts(
title_opts=opts.TitleOpts(title="一天用电量分布", subtitle="纯属虚构"),
tooltip_opts=opts.TooltipOpts(trigger="axis", axis_pointer_type="cross"),
xaxis_opts=opts.AxisOpts(boundary_gap=False),
yaxis_opts=opts.AxisOpts(
axislabel_opts=opts.LabelOpts(formatter="{value} W"),
splitline_opts=opts.SplitLineOpts(is_show=True),
),
visualmap_opts=opts.VisualMapOpts(
is_piecewise=True,
dimension=0,
pieces=[
{"lte": 6, "color": "green"},
{"gt": 6, "lte": 8, "color": "red"},
{"gt": 8, "lte": 14, "color": "green"},
{"gt": 14, "lte": 17, "color": "red"},
{"gt": 17, "color": "green"},
],
),
)
.set_series_opts(
markarea_opts=opts.MarkAreaOpts(
data=[
opts.MarkAreaItem(name="早高峰", x=("07:30", "10:00")),
opts.MarkAreaItem(name="晚高峰", x=("17:30", "21:15")),
]
)
)
.render("用电量折线图.html")
)
断点折线图(根据场景进行配置)
import pyecharts.options as opts
from pyecharts.charts import Line
(
Line(init_opts=opts.InitOpts(width="1200px", height="600px"))
.add_xaxis(xaxis_data=["Mon", "Tue", "Wed", "Thu", "Fri", "Sat", "Sun"])
.add_yaxis(
series_name="",
y_axis=[120, 200, 150, 80, 70, 110, 130],
symbol="triangle",
symbol_size=20,
linestyle_opts=opts.LineStyleOpts(color="green", width=4, type_="dashed"),
label_opts=opts.LabelOpts(is_show=False),
itemstyle_opts=opts.ItemStyleOpts(
border_width=3, border_color="yellow", color="blue"
),
)
.set_global_opts(
xaxis_opts=opts.AxisOpts(type_="category",
name='类别',
name_location='middle',
name_gap=30, # 标签与轴线之间的距离,默认为20,最好不要设置20
name_textstyle_opts=opts.TextStyleOpts(
font_family='Times New Roman',
font_size=16 # 标签字体大小
)
),
yaxis_opts=opts.AxisOpts(
type_="value",
axistick_opts=opts.AxisTickOpts(is_show=True),
splitline_opts=opts.SplitLineOpts(is_show=True),
),
tooltip_opts=opts.TooltipOpts(is_show=False),
)
.render("断点折线图.html")
)
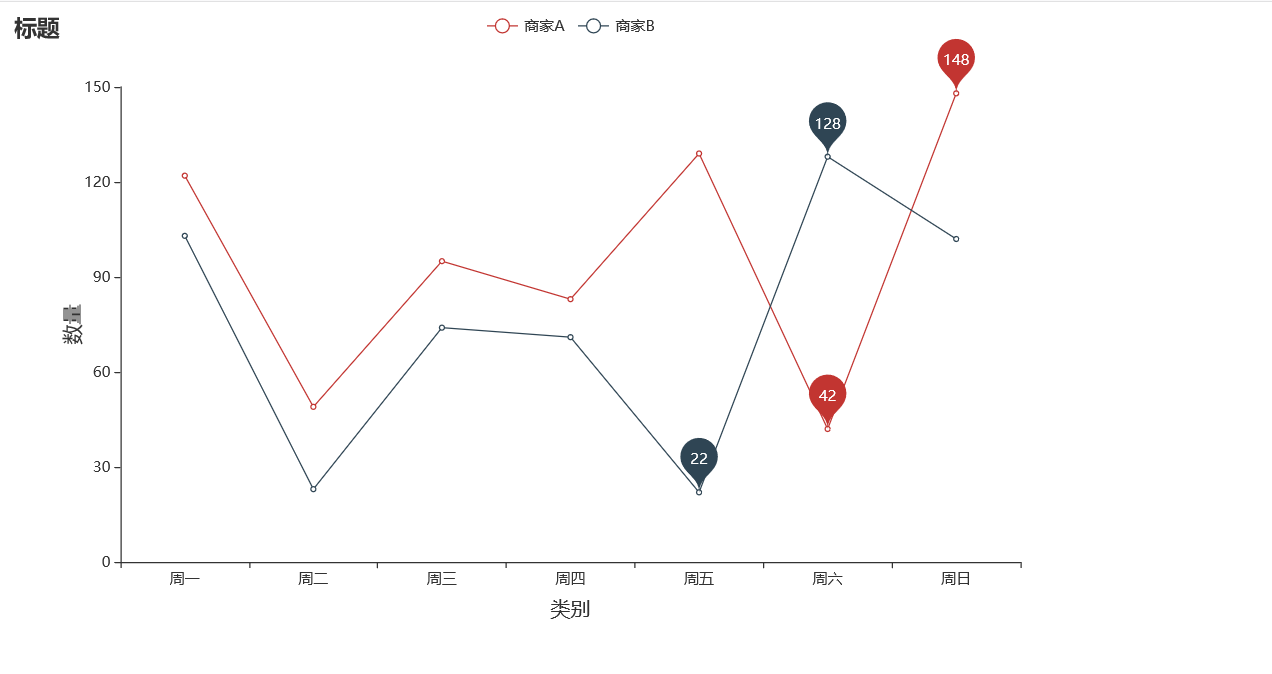
双折线图显示最低最高数据标签(不显示其他数据标签)
有时候折线图里面的数据太多了,但是我们想要一眼就直观的看到数据的最低最高是多少,虽然pyecharts可以把鼠标放在点上就会显示,但是如果做出PPT或者图片,那么就有点不现实了。
import pyecharts.options as opts
from pyecharts.charts import Line
from pyecharts.faker import Faker

c = (
Line()
.add_xaxis(Faker.choose())
.add_yaxis(
"商家A",
Faker.values(),
label_opts=opts.LabelOpts(is_show=False),
markpoint_opts=opts.MarkPointOpts(data=[opts.MarkPointItem(type_="min"),
opts.MarkPointItem(type_="max")]),

)
.add_yaxis(
"商家B",
Faker.values(),
label_opts=opts.LabelOpts(is_show=False),
markpoint_opts=opts.MarkPointOpts(data=[opts.MarkPointItem(type_="min"),
opts.MarkPointItem(type_="max")]),
)
.set_global_opts(title_opts=opts.TitleOpts(title="标题"),
xaxis_opts=opts.AxisOpts(
name='类别',
name_location='middle',
name_gap=30, # 标签与轴线之间的距离,默认为20,最好不要设置20
name_textstyle_opts=opts.TextStyleOpts(
font_family='Times New Roman',
font_size=16 # 标签字体大小
)),
yaxis_opts=opts.AxisOpts(
name='数量',
name_location='middle',
name_gap=30,
name_textstyle_opts=opts.TextStyleOpts(
font_family='Times New Roman',
font_size=16
# font_weight='bolder',
)),
# toolbox_opts=opts.ToolboxOpts() # 工具选项
)
.render("双折线图显示最低最高.html")
)
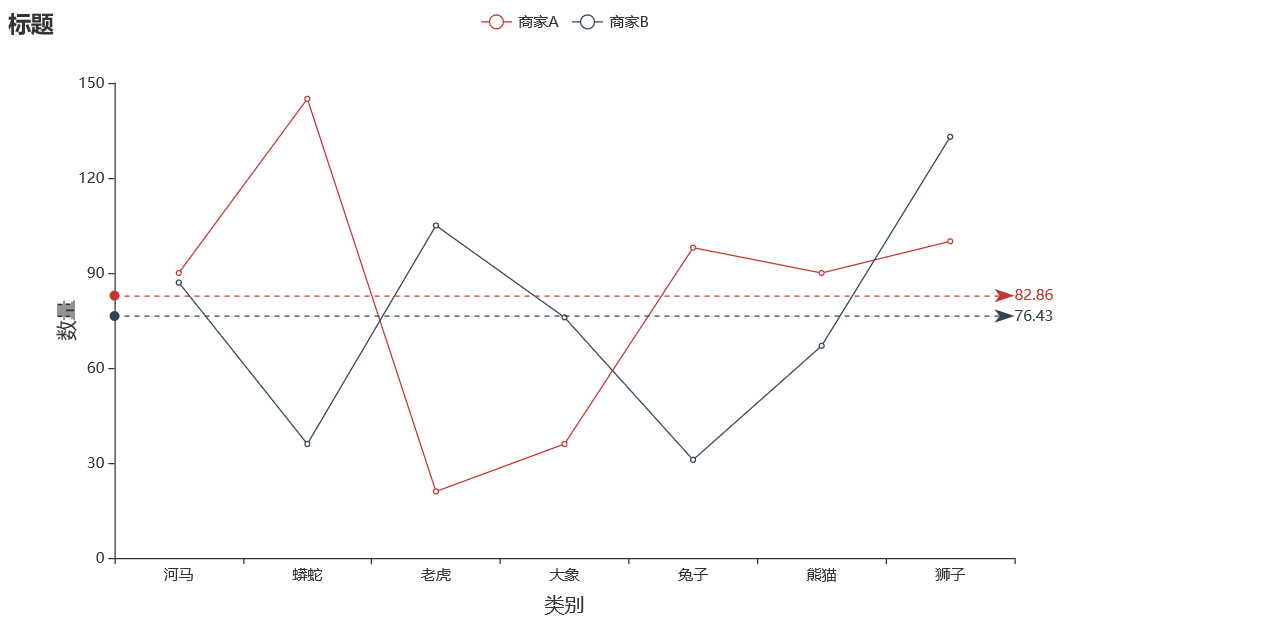
双折线图显示平均刻度数据标签(数据可显示)
这个双折线图可以运用在我们需要知道一类数据集里面的平均值是多少,那么我们就可以根据这个来配置相关参数了,下面的图例我们没有显示数据,也可以显示数据。
import pyecharts.options as opts
from pyecharts.charts import Line
from pyecharts.faker import Faker

c = (
Line()
.add_xaxis(Faker.choose())
.add_yaxis(
"商家A",
Faker.values(),
label_opts=opts.LabelOpts(is_show=False),#允许显示数据
markline_opts=opts.MarkLineOpts(data=[opts.MarkLineItem(type_="average")]),
)
.add_yaxis(
"商家B",
Faker.values(),
label_opts=opts.LabelOpts(is_show=False),
markline_opts=opts.MarkLineOpts(data=[opts.MarkLineItem(type_="average")]),
)
.set_global_opts(title_opts=opts.TitleOpts(title="标题"),
xaxis_opts=opts.AxisOpts(
name='类别',
name_location='middle',
name_gap=30, # 标签与轴线之间的距离,默认为20,最好不要设置20
name_textstyle_opts=opts.TextStyleOpts(
font_family='Times New Roman',
font_size=16 # 标签字体大小
)),
yaxis_opts=opts.AxisOpts(
name='数量',
name_location='middle',
name_gap=30,
name_textstyle_opts=opts.TextStyleOpts(
font_family='Times New Roman',
font_size=16
# font_weight='bolder',
)),
# toolbox_opts=opts.ToolboxOpts() # 工具选项
)
.render("双折线图显示平均刻度.html")
)
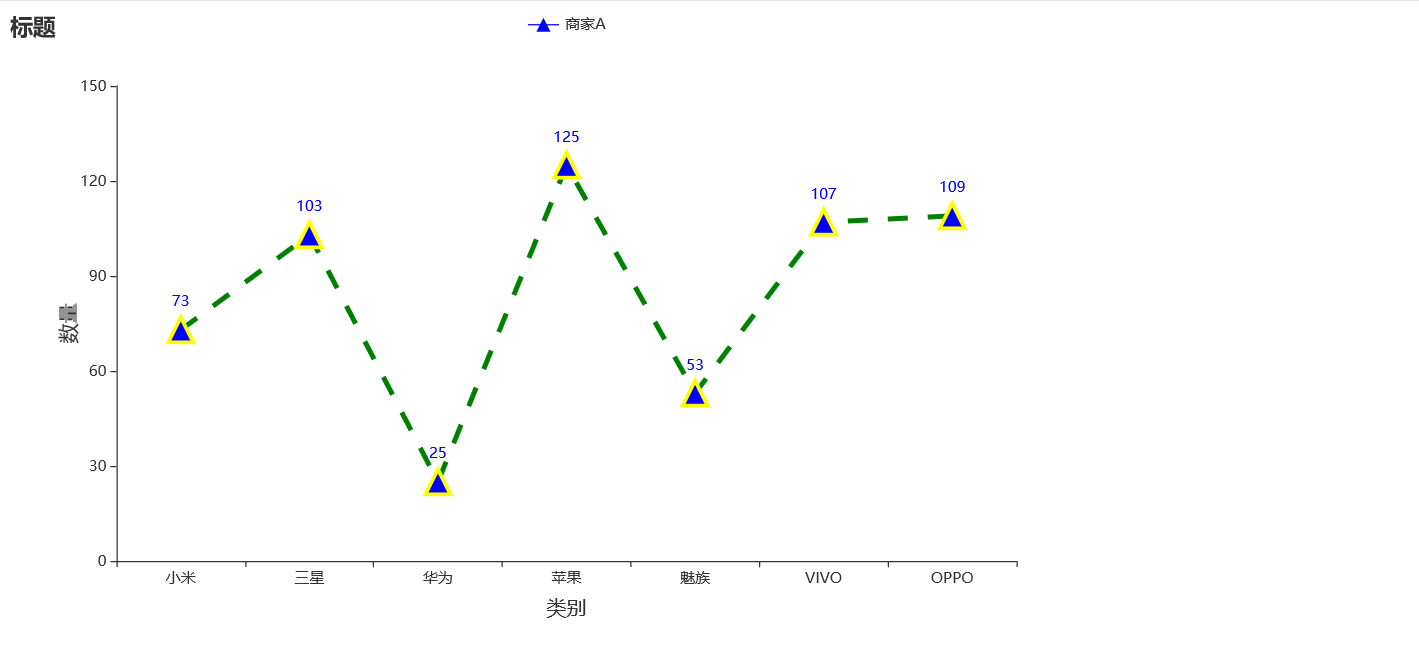
断点折线图(显示数据项)
前面的图例里面,没有对数据进行展示,也没有数据标签,这个图例是对之前的进行改造和设计升级的。
import pyecharts.options as opts
from pyecharts.charts import Line
from pyecharts.faker import Faker

c = (
Line()
.add_xaxis(xaxis_data=Faker.choose())
.add_yaxis(
"商家A",
Faker.values(),
symbol="triangle",
symbol_size=20,
linestyle_opts=opts.LineStyleOpts(color="green", width=4, type_="dashed"),
itemstyle_opts=opts.ItemStyleOpts(
border_width=3, border_color="yellow", color="blue"
),#可进行多维叠加
)
.set_global_opts(title_opts=opts.TitleOpts(title="标题"),
xaxis_opts=opts.AxisOpts(
name='类别',
name_location='middle',
name_gap=30, # 标签与轴线之间的距离,默认为20,最好不要设置20
name_textstyle_opts=opts.TextStyleOpts(
font_family='Times New Roman',
font_size=16 # 标签字体大小
)),
yaxis_opts=opts.AxisOpts(
name='数量',
name_location='middle',
name_gap=30,
name_textstyle_opts=opts.TextStyleOpts(
font_family='Times New Roman',
font_size=16
# font_weight='bolder',
)),
# toolbox_opts=opts.ToolboxOpts() # 工具选项
)
.render("断点显示数据.html")
)
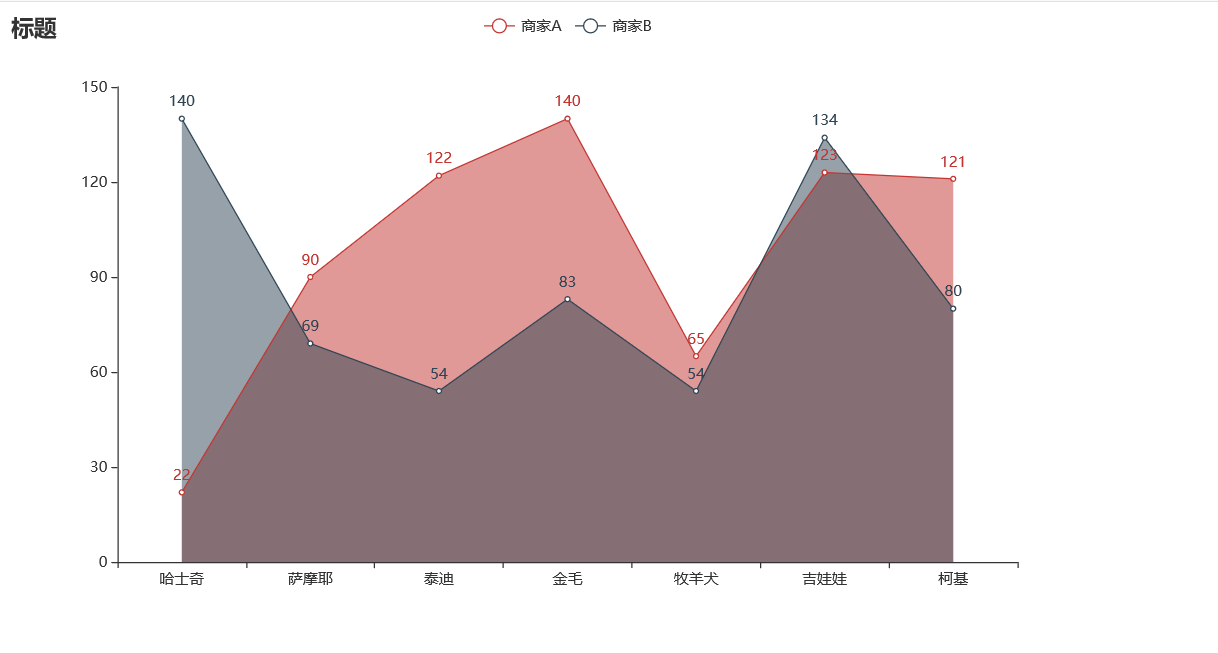
面积折线图(不紧贴)
前面有一个图形是一个曲线的折线图,紧贴Y轴,此图例是不紧贴的且是折线的形式。
import pyecharts.options as opts
from pyecharts.charts import Line
from pyecharts.faker import Faker

c = (
Line()
.add_xaxis(Faker.choose())
.add_yaxis("商家A", Faker.values(), areastyle_opts=opts.AreaStyleOpts(opacity=0.5))
.add_yaxis("商家B", Faker.values(), areastyle_opts=opts.AreaStyleOpts(opacity=0.5))
.set_global_opts(title_opts=opts.TitleOpts(title="标题"))
.render("面积折线图不紧贴.html")
)
3D旋转弹簧图
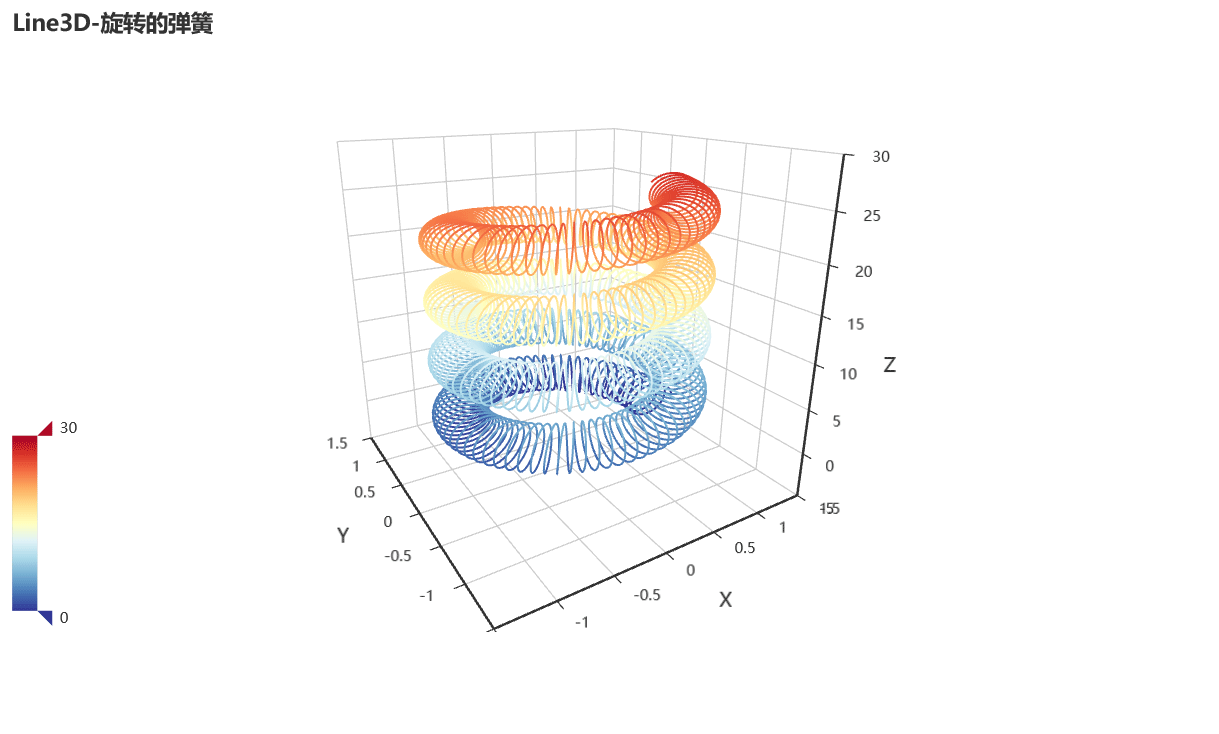
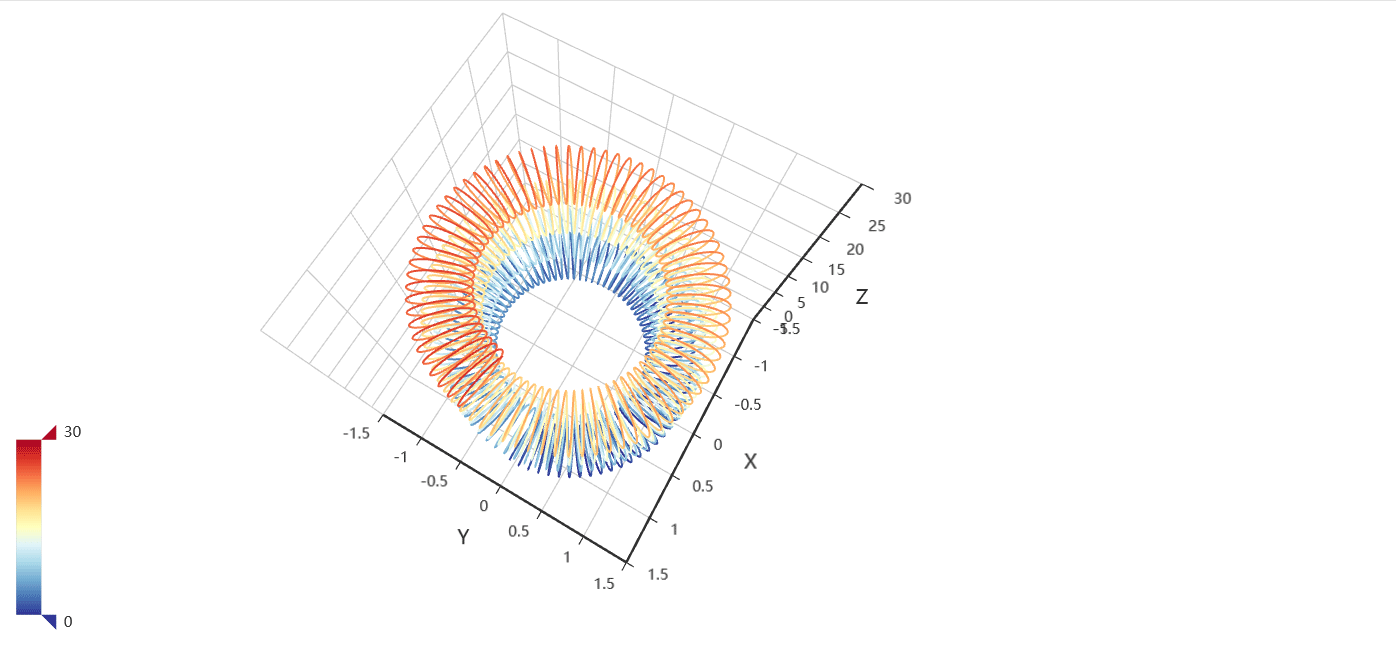
运行生成之后,自动旋转。有的小伙伴很是好奇,为什么会有这种炫酷的图形,这种图形是如何设计出来的,看了代码我们发现其实并不难,代码量也不是很复杂,原因就是它基于算法数学设计的,这也就是为什么说有“几何之美”的这一概念了。
加载全部内容