R语言 ROC图
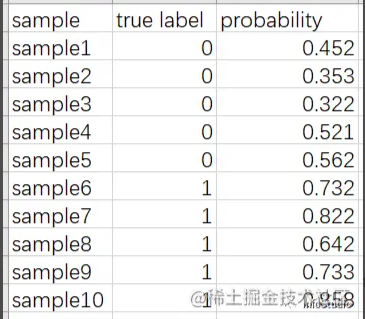
科研君 人气:0pROC是一个专门用来计算和绘制ROC曲线的R包,目前已被CRAN收录,因此安装也非常简单,同时该包也兼容ggplot2函数绘图,本次就教大家怎么用pROC来快速画出ROC图。在医学领域主要用于判断某种因素对于某种疾病的诊断是否有诊断价值。什么是ROC曲线和AUC,以及如何去看ROC曲线的结果,可以这样总结:ROC曲线呢,其实就是每个对应的cutoff值都有一个对应的真阳性率(纵坐标)和假阳性率(横坐标),比如选择了10个cutoff值,那就相当于有个10个点,把这些点连成一条线就是ROC曲线。AUC值就是ROC曲线下的面积,一般认为AUC值在0.7~1之间,模型预测的结果才有效。TPR(真阳性率) = TP(真阳)/(TP(真阳) + FN(假阴)),FPR(假阳性率) = FP(假阳) / (FP(假阳) + TN(真阴))。 比如下面的一个模型预测后的数据结果:

上图中如果选cutoff值为0.5时
TPR = 5 /(5 + 0)= 1,
FPR = 2 / (2 + 3) = 0.4,
预测的准确性 = (TP + TN )/ 总的样本数 = (5 + 3)/10 = 0.8
好了,话不多说,我们直接上代码
1.读取数据
library(openxlsx)
ROC <- read.xlsx("ROC曲线.xlsx")
2.AUC和CI的计算
library(pROC)
## roc的计算,可以一次性批量计算a、b、c三组数据
res<-roc(outcome~a+b+c,data=ROC,aur=TRUE,
         ci=TRUE, # 显示95%CI
         # percent=TRUE, ##是否需要以百分比显示
         levels=c('group1','group2'),direction=">" #设置分组方向
         )
## 平滑曲线的ROC结果
smooth<-roc(outcome~a+b+c,data=ROC,aur=TRUE,
         ci=TRUE, # 显示95%CI
         # percent=TRUE, ##是否需要以百分比显示
         smooth=TRUE,
         levels=c('group1','group2'),direction=">" #设置分组方向
         )
显示非平滑ROC曲线的结果
res
Call:
roc.formula(formula = outcome ~ a, data = ROC, aur = TRUE, ci = TRUE,     levels = c("group1", "group2"), direction = ">")
Data: a in 40 controls (outcome group1) > 32 cases (outcome group2).
Area under the curve: 0.7328
95% CI: 0.6171-0.8485 (DeLong)
$b
Call:
roc.formula(formula = outcome ~ b, data = ROC, aur = TRUE, ci = TRUE,     levels = c("group1", "group2"), direction = ">")

Data: b in 40 controls (outcome group1) > 32 cases (outcome group2).
Area under the curve: 0.8234
95% CI: 0.7303-0.9165 (DeLong)
$c
Call:
roc.formula(formula = outcome ~ c, data = ROC, aur = TRUE, ci = TRUE,     levels = c("group1", "group2"), direction = ">")

Data: c in 40 controls (outcome group1) > 32 cases (outcome group2).
Area under the curve: 0.9242
95% CI: 0.8679-0.9805 (DeLong)
3.利用ggplot2绘图
library(ggplot2)
pa<- ggroc(smooth$a,
       legacy.axes = TRUE # 将X轴改为0-1,(默认是1-0)
       )+
   geom_segment(aes(x = 0, xend = 1, y = 0, yend = 1),
                color="darkgrey", linetype=4)+
 theme_bw() +# 设置背景
 ggtitle('a-ROC')
pb<- ggroc(smooth$b, legacy.axes = TRUE)+geom_segment(aes(x = 0, xend = 1, y = 0, yend = 1), color="darkgrey", linetype=4)+theme_bw() +ggtitle('b-ROC')
pc<- ggroc(smooth$c, legacy.axes = TRUE)+geom_segment(aes(x = 0, xend = 1, y = 0, yend = 1), color="darkgrey", linetype=4)+theme_bw() +ggtitle('c-ROC')
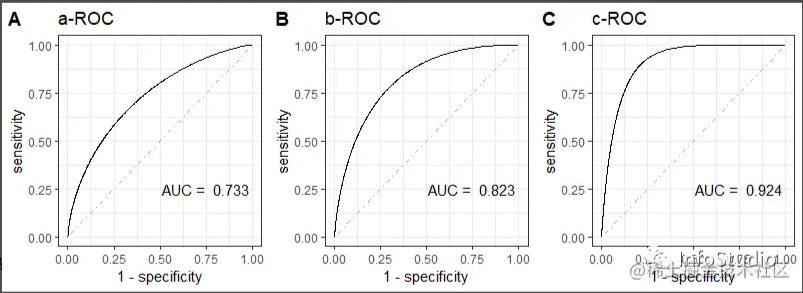
cowplot::plot_grid(pa,pb,pc,labels = "AUTO",nrow = 1)
4.合并多个ROC曲线结果
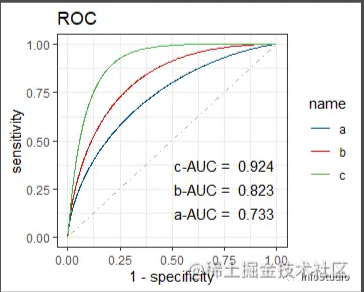
ggroc(smooth, legacy.axes = TRUE)+
    geom_segment(aes(x = 0, xend = 1, y = 0, yend = 1), color="darkgrey", linetype=4)+
    theme_bw()+ggtitle('ROC')+ggsci::scale_color_lancet()+
    annotate("text",x=0.75,y=0.125,label=paste("a-AUC = ", round(res$a$auc,3)))+
    annotate("text",x=0.75,y=0.25,label=paste("b-AUC = ", round(res$b$auc,3)))+
    annotate("text",x=0.75,y=0.375,label=paste("c-AUC = ", round(res$c$auc,3)))
加载全部内容