Python获取脚本
北江爱国 人气:0前言
有时候大家需要知道一个关键词在互联网上的热度,想知道某个关键词的热度变化趋势。大家可能就是使用百度指数、微信指数之类的。非常好用,但是就是不能把数据下载保存下来,不方便我们后面进行操作。
我无意间看到别人提供的python脚本,可以对百度指数进行爬虫,于是我稍微修改了部分代码,做了一个可以直接返回pd.DataFrame的数据框的类;然后后面又加了一个小的可视化代码。这里和大家分享,只要使用这个脚本,就可以将百度指数数据下载下来,并且保存。
具体步骤
1. 获得cookie值
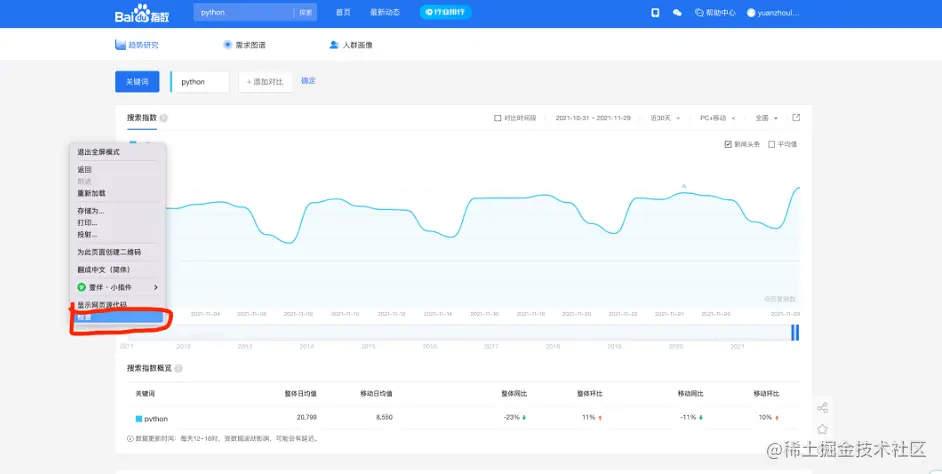
百度指数是需要登陆,进行用户验证,因此,我们要登陆百度指数,然后随便搜索一个关键词,比如python。然后在网页空白地方,右键打开【检查】,然后进入【网络】

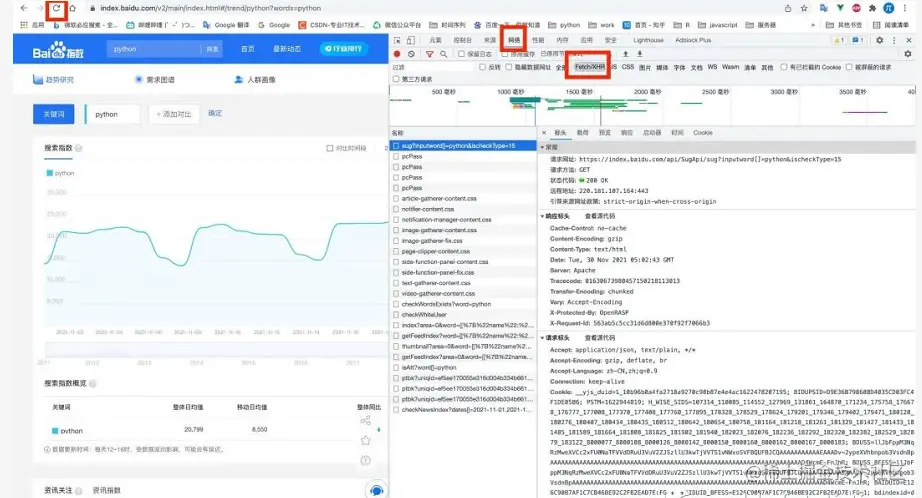
这个时候会发现【网络】里面都是空的,需要重新刷新网页即可看到所有内容。内容太多了,注意选择【Fetch/XHR】.

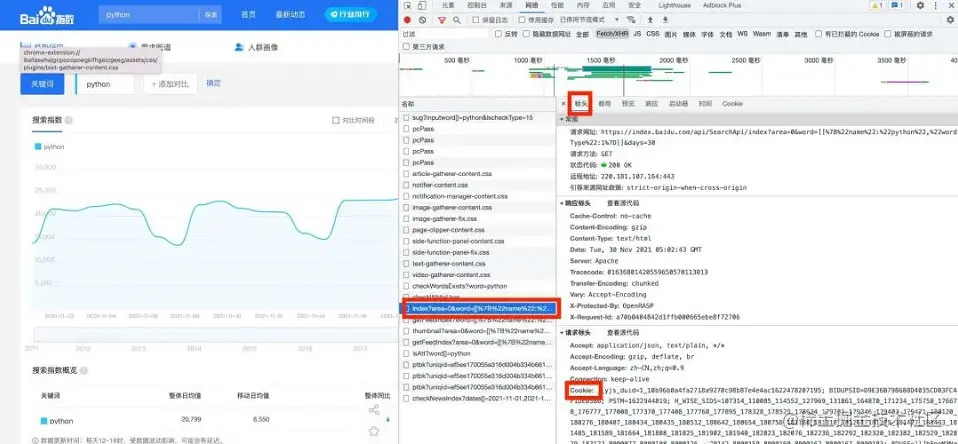
然后找到index?开头的文件,查看他的【标头】、查看他的【Cookie】.将这个cookie的值复制

2. 使用我的代码
基础代码,只要复制好就行:
import requests
import json
from datetime import date, timedelta
import pandas as pd
class DownloadBaiDuIndex(object):
    def __init__(self, cookie):
        self.cookie = cookie
        self.headers = {
            "Connection": "keep-alive",
            "Accept": "application/json, text/plain, */*",
            "User-Agent": "Mozilla/5.0 (Windows NT 10.0; WOW64) AppleWebKit/537.36 (KHTML, like Gecko) Chrome/86.0.4240.198 Safari/537.36",
            "Sec-Fetch-Site": "same-origin",
            "Sec-Fetch-Mode": "cors",
            "Sec-Fetch-Dest": "empty",
            "Referer": "https://index.baidu.com/v2/main/index.html",
            "Accept-Language": "zh-CN,zh;q=0.9",
            'Cookie': self.cookie,
        }

    def decrypt(self, ptbk, index_data):
        n = len(ptbk) // 2
        a = dict(zip(ptbk[:n], ptbk[n:]))
        return "".join([a[s] for s in index_data])

    def get_index_data_json(self, keys, start=None, end=None):
        words = [[{"name": key, "wordType": 1}] for key in keys]
        words = str(words).replace(" ", "").replace("'", """)

        url = f'http://index.baidu.com/api/SearchApi/index?area=0&word={words}&area=0&startDate={start}&endDate={end}'
        print(words, start, end)
        res = requests.get(url, headers=self.headers)
        data = res.json()['data']
        uniqid = data['uniqid']
        url = f'http://index.baidu.com/Interface/ptbk?uniqid={uniqid}'
        res = requests.get(url, headers=self.headers)
        ptbk = res.json()['data']
        result = {}
        result["startDate"] = start
        result["endDate"] = end
        for userIndexe in data['userIndexes']:
            name = userIndexe['word'][0]['name']
            tmp = {}
            index_all = userIndexe['all']['data']
            index_all_data = [int(e) for e in self.decrypt(ptbk, index_all).split(",")]
            tmp["all"] = index_all_data
            index_pc = userIndexe['pc']['data']
            index_pc_data = [int(e) for e in self.decrypt(ptbk, index_pc).split(",")]
            tmp["pc"] = index_pc_data
            index_wise = userIndexe['wise']['data']
            index_wise_data = [int(e)
                               for e in self.decrypt(ptbk, index_wise).split(",")]
            tmp["wise"] = index_wise_data
            result[name] = tmp
        return result

    def GetIndex(self, keys, start=None, end=None):
        today = date.today()
        if start is None:
            start = str(today - timedelta(days=8))
        if end is None:
            end = str(today - timedelta(days=2))

        try:
            raw_data = self.get_index_data_json(keys=keys, start=start, end=end)
            raw_data = pd.DataFrame(raw_data[keys[0]])
            raw_data.index = pd.date_range(start=start, end=end)

        except Exception as e:
            print(e)
            raw_data = pd.DataFrame({'all': [], 'pc': [], 'wise': []})

        finally:
            return raw_data
使用上面的类:
使用上面的类,然后使用下面的代码。先初始化类,然后在使用这个对象的GetIndex函数,里面的参数keys就是传递一个关键词就行,要用列表形式传递。
说更加简单一点的,只要把python替换成别的关键词就行了,然后时间也都是文本形式,样式就是'yyyy-mm-dd'形式就行。
cookie = '你的cookie值,注意使用英文单引号;就是直接复制就行了'
# 初始化一个类
downloadbaiduindex = DownloadBaiDuIndex(cookie=cookie)
data = downloadbaiduindex.GetIndex(keys=['python'], start='2021-01-01', end='2021-11-12')
data
保存数据
如果想保存数据,直接可以这么写:
data.to_csv('data.csv')可视化
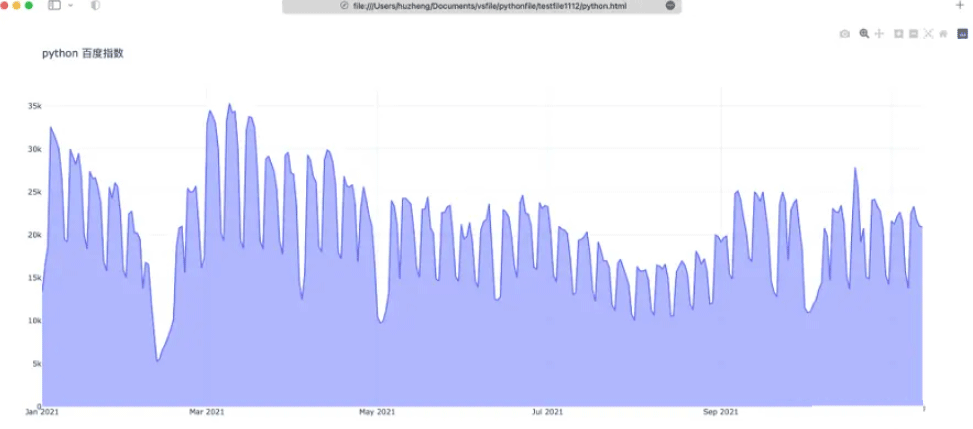
获得数据已经很简单了,接下来可视化,就是非常简单的事情了,你用别的语言处理数据也都可以了。我这里简单的画一个时间序列图:
import plotly.graph_objects as go
import pandas as pd
df = data
fig = go.Figure([go.Scatter(x=df.index, y=df['all'], fill='tozeroy')])
fig.update_layout(template='plotly_white', title='python 百度指数')
fig.show()
fig.write_html('python.html')
结果如下:

总结
上面基本上没有任何难点了,只要没把cookie复制错,只要没有把上面的参数写错就行。
加载全部内容