PyTorch LSTM多变量时序负荷预测
Cyril_KI 人气:0I. 前言
在前面的一篇文章PyTorch搭建LSTM实现时间序列预测(负荷预测)中,我们利用LSTM实现了负荷预测,但我们只是简单利用负荷预测负荷,并没有利用到其他一些环境变量,比如温度、湿度等。
本篇文章主要考虑用PyTorch搭建LSTM实现多变量时间序列预测。
系列文章:
PyTorch深度学习LSTM从input输入到Linear输出
II. 数据处理
数据集为某个地区某段时间内的电力负荷数据,除了负荷以外,还包括温度、湿度等信息。
本文中,我们根据前24个时刻的负荷以及该时刻的环境变量来预测下一时刻的负荷。
def load_data(file_name):
    global MAX, MIN
    df = pd.read_csv(os.path.dirname(os.getcwd()) + '/data/new_data/' + file_name, encoding='gbk')
    columns = df.columns
    df.fillna(df.mean(), inplace=True)
    MAX = np.max(df[columns[1]])
    MIN = np.min(df[columns[1]])
    df[columns[1]] = (df[columns[1]] - MIN) / (MAX - MIN)
    return df
class MyDataset(Dataset):
    def __init__(self, data):
        self.data = data
    def __getitem__(self, item):
        return self.data[item]
    def __len__(self):
        return len(self.data)
def nn_seq(file_name, B):
    print('处理数据:')
    data = load_data(file_name)
    load = data[data.columns[1]]
    load = load.tolist()
    data = data.values.tolist()
    seq = []
    for i in range(len(data) - 24):
        train_seq = []
        train_label = []
        for j in range(i, i + 24):
            x = [load[j]]
            for c in range(2, 8):
                x.append(data[j][c])
            train_seq.append(x)
        train_label.append(load[i + 24])
        train_seq = torch.FloatTensor(train_seq)
        train_label = torch.FloatTensor(train_label).view(-1)
        seq.append((train_seq, train_label))
    # print(seq[:5])
    Dtr = seq[0:int(len(seq) * 0.7)]
    Dte = seq[int(len(seq) * 0.7):len(seq)]
    train_len = int(len(Dtr) / B) * B
    test_len = int(len(Dte) / B) * B
    Dtr, Dte = Dtr[:train_len], Dte[:test_len]
    train = MyDataset(Dtr)
    test = MyDataset(Dte)
    Dtr = DataLoader(dataset=train, batch_size=B, shuffle=False, num_workers=0)
    Dte = DataLoader(dataset=test, batch_size=B, shuffle=False, num_workers=0)
    return Dtr, Dte
上面代码用了DataLoader来对原始数据进行处理,最终得到了batch_size=B的数据集Dtr和Dte,Dtr为训练集,Dte为测试集。
任意输出Dte中的一条数据:
[(tensor([[0.3513, 0.0000, 0.9091, 0.0000, 0.6667, 0.3023, 0.2439],
        [0.3333, 0.0000, 0.9091, 0.0435, 0.6667, 0.3023, 0.2439],
        [0.3396, 0.0000, 0.9091, 0.0870, 0.6667, 0.3023, 0.2439],
        [0.3427, 0.0000, 0.9091, 0.1304, 0.6667, 0.3023, 0.2439],
        [0.3838, 0.0000, 0.9091, 0.1739, 0.6667, 0.3023, 0.2439],
        [0.3700, 0.0000, 0.9091, 0.2174, 0.6667, 0.3023, 0.2439],
        [0.4288, 0.0000, 0.9091, 0.2609, 0.6667, 0.3023, 0.2439],
        [0.4474, 0.0000, 0.9091, 0.3043, 0.6667, 0.3023, 0.2439],
        [0.4406, 0.0000, 0.9091, 0.3478, 0.6667, 0.3023, 0.2439],
        [0.4657, 0.0000, 0.9091, 0.3913, 0.6667, 0.3023, 0.2439],
        [0.4540, 0.0000, 0.9091, 0.4348, 0.6667, 0.3023, 0.2439],
        [0.4939, 0.0000, 0.9091, 0.4783, 0.6667, 0.3023, 0.2439],
        [0.4328, 0.0000, 0.9091, 0.5217, 0.6667, 0.3023, 0.2439],
        [0.4238, 0.0000, 0.9091, 0.5652, 0.6667, 0.3023, 0.2439],
        [0.4779, 0.0000, 0.9091, 0.6087, 0.6667, 0.3023, 0.2439],
        [0.4591, 0.0000, 0.9091, 0.6522, 0.6667, 0.3023, 0.2439],
        [0.4651, 0.0000, 0.9091, 0.6957, 0.6667, 0.3023, 0.2439],
        [0.5102, 0.0000, 0.9091, 0.7391, 0.6667, 0.3023, 0.2439],
        [0.5067, 0.0000, 0.9091, 0.7826, 0.6667, 0.3023, 0.2439],
        [0.4635, 0.0000, 0.9091, 0.8261, 0.6667, 0.3023, 0.2439],
        [0.4224, 0.0000, 0.9091, 0.8696, 0.6667, 0.3023, 0.2439],
        [0.3796, 0.0000, 0.9091, 0.9130, 0.6667, 0.3023, 0.2439],
        [0.3292, 0.0000, 0.9091, 0.9565, 0.6667, 0.3023, 0.2439],
        [0.2940, 0.0000, 0.9091, 1.0000, 0.6667, 0.3023, 0.2439]]), tensor([0.3675]))]
每一行对应一个时刻点的负荷以及环境变量,此时input_size=7。
III. LSTM模型
这里采用了深入理解PyTorch中LSTM的输入和输出(从input输入到Linear输出)中的模型:
class LSTM(nn.Module):
    def __init__(self, input_size, hidden_size, num_layers, output_size, batch_size):
        super().__init__()
        self.input_size = input_size
        self.hidden_size = hidden_size
        self.num_layers = num_layers
        self.output_size = output_size
        self.num_directions = 1
        self.batch_size = batch_size
        self.lstm = nn.LSTM(self.input_size, self.hidden_size, self.num_layers, batch_first=True)
        self.linear = nn.Linear(self.hidden_size, self.output_size)
    def forward(self, input_seq):
        h_0 = torch.randn(self.num_directions * self.num_layers, self.batch_size, self.hidden_size).to(device)
        c_0 = torch.randn(self.num_directions * self.num_layers, self.batch_size, self.hidden_size).to(device)
        # print(input_seq.size())
        seq_len = input_seq.shape[1]
        # input(batch_size, seq_len, input_size)
        input_seq = input_seq.view(self.batch_size, seq_len, self.input_size)
        # output(batch_size, seq_len, num_directions * hidden_size)
        output, _ = self.lstm(input_seq, (h_0, c_0))
        # print('output.size=', output.size())
        # print(self.batch_size * seq_len, self.hidden_size)
        output = output.contiguous().view(self.batch_size * seq_len, self.hidden_size)  # (5 * 30, 64)
        pred = self.linear(output)  # pred()
        # print('pred=', pred.shape)
        pred = pred.view(self.batch_size, seq_len, -1)
        pred = pred[:, -1, :]
        return pred
IV. 训练
def LSTM_train(name, b):
    Dtr, Dte = nn_seq(file_name=name, B=b)
    input_size, hidden_size, num_layers, output_size = 7, 64, 1, 1
    model = LSTM(input_size, hidden_size, num_layers, output_size, batch_size=b).to(device)
    loss_function = nn.MSELoss().to(device)
    optimizer = torch.optim.Adam(model.parameters(), lr=0.05)
    # 训练
    epochs = 30
    for i in range(epochs):
        cnt = 0
        print('当前', i)
        for (seq, label) in Dtr:
            cnt += 1
            seq = seq.to(device)
            label = label.to(device)
            y_pred = model(seq)
            loss = loss_function(y_pred, label)
            optimizer.zero_grad()
            loss.backward()
            optimizer.step()
            if cnt % 100 == 0:
                print('epoch', i, ':', cnt - 100, '~', cnt, loss.item())
    state = {'model': model.state_dict(), 'optimizer': optimizer.state_dict()}
    torch.save(state, LSTM_PATH)
V. 测试
def test(name, b):
    global MAX, MIN
    Dtr, Dte = nn_seq(file_name=name, B=b)
    pred = []
    y = []
    print('loading model...')
    input_size, hidden_size, num_layers, output_size = 7, 64, 1, 1
    model = LSTM(input_size, hidden_size, num_layers, output_size, batch_size=b).to(device)
    model.load_state_dict(torch.load(LSTM_PATH)['model'])
    model.eval()
    print('predicting...')
    for (seq, target) in Dte:
        target = list(chain.from_iterable(target.data.tolist()))
        y.extend(target)
        seq = seq.to(device)
        with torch.no_grad():
            y_pred = model(seq)
            y_pred = list(chain.from_iterable(y_pred.data.tolist()))
            pred.extend(y_pred)
    y, pred = np.array([y]), np.array([pred])
    y = (MAX - MIN) * y + MIN
    pred = (MAX - MIN) * pred + MIN
    print('accuracy:', get_mape(y, pred))
    # plot
    x = [i for i in range(1, 151)]
    x_smooth = np.linspace(np.min(x), np.max(x), 900)
    y_smooth = make_interp_spline(x, y.T[150:300])(x_smooth)
    plt.plot(x_smooth, y_smooth, c='green', marker='*', ms=1, alpha=0.75, label='true')
    y_smooth = make_interp_spline(x, pred.T[150:300])(x_smooth)
    plt.plot(x_smooth, y_smooth, c='red', marker='o', ms=1, alpha=0.75, label='pred')
    plt.grid(axis='y')
    plt.legend()
    plt.show()
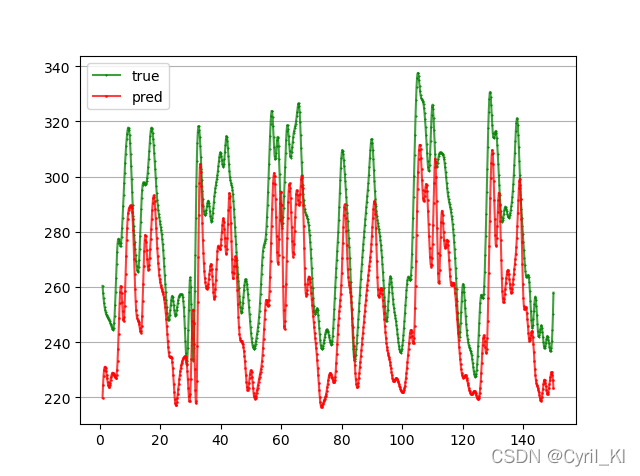
我只是训练了30轮,MAPE为7.83%:


VI. 源码及数据
源码及数据我放在了GitHub上,LSTM-Load-Forecasting
加载全部内容