python数据可视化操作
橙橙小狸猫 人气:00. 前言
数据处理过程中,可视化可以更直观得感受数据,因此打算结合自己的一些实践经理,以效果为准写这篇博客。内容应该会不断扩充。
1. matplotlib中figure、subplot和plot等什么关系
记住这几个关系可以结合实际。假设你去外面写生要带哪些工具呢,包括画板、画纸还有画笔,那么就可以一一对应了。
| 函数 | 工具 |
|---|---|
| figure | 画板 |
| subplot、add_subplot | 画纸 |
| plot、hist、scatter | 画笔 |
那么再往深处想,画纸贴在画板上,画纸可以裁剪成多块布局在画板上,而画笔只能画在纸上,可能这样讲有点笼统,下面一个代码配合注释就可以清晰明白啦。(感觉需要记住以下代码)
代码
import matplotlib.pyplot as plt
import numpy as np
# 拿起画板
fig = plt.figure()
# 在画板上贴上画纸
ax1 = fig.add_subplot(221)
ax2 = fig.add_subplot(222)
ax3 = fig.add_subplot(223)
# 一步完成(直接拿起画板和画纸)-----------------
# ax1 = plt.subplot(221)
# ax2 = plt.subplot(222)
# ax3 = plt.subplot(223)
# ----------------------------------------
# 在画纸上作图
ax1.hist(np.random.randn(100), bins=20, color='k', alpha=0.3)
ax2.scatter(np.arange(30), np.arange(30) + 3 * np.random.randn(30))
ax3.plot(np.random.randn(50).cumsum(), 'k--')
plt.show()
运行结果
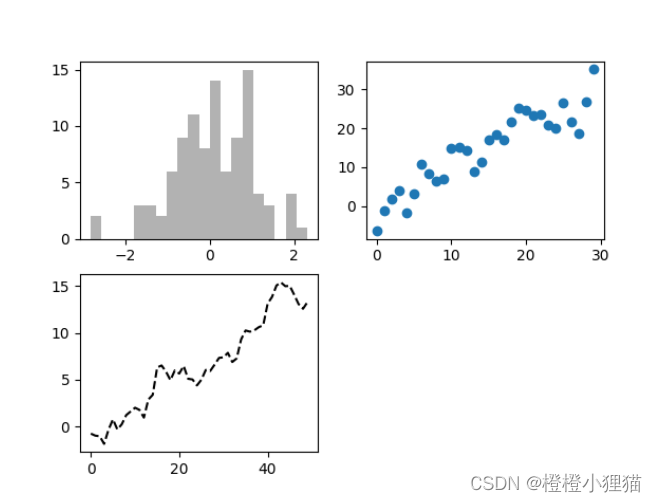
函数解析
| 代码行 | 作用 | 参考链接 |
|---|---|---|
| ax1.hist(np.random.randn(100), bins=20, color=‘k’, alpha=0.3) | 绘制直方图 | python用hist参数解读 |
2. 画图的细节修改
依次完成以下的画图效果:
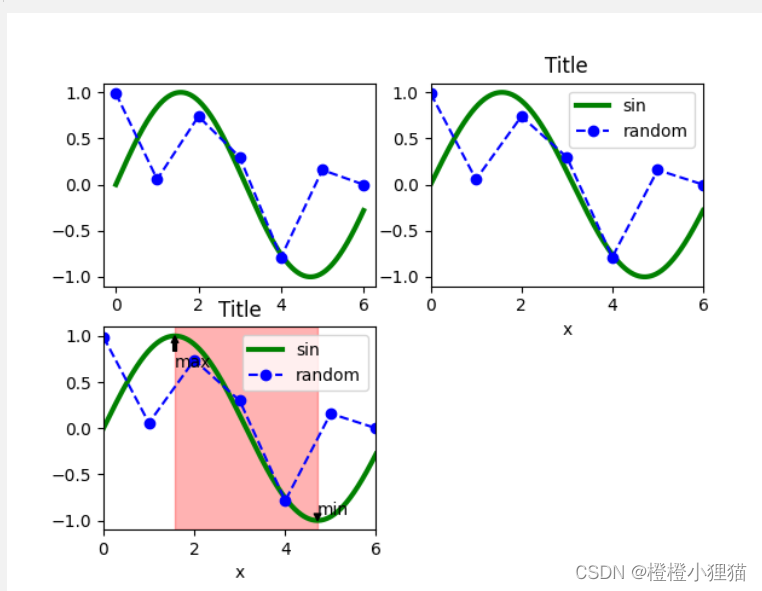
1.一个正弦函数和一个随机数值的曲线,正弦函数直线,随机数值曲线虚线以及其他样式修改;
2.图例、标签等修改;
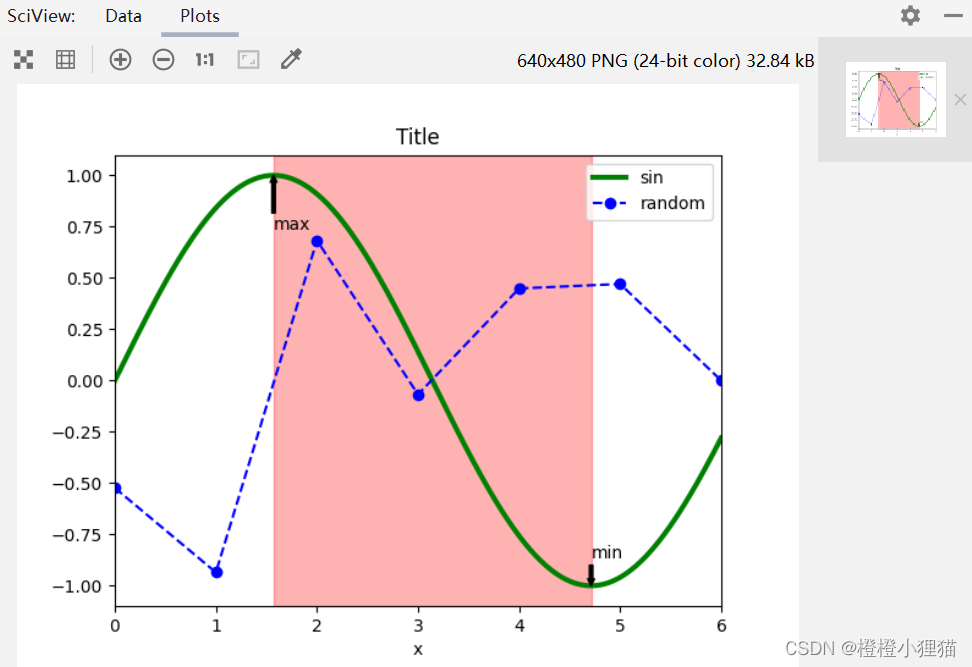
3.加上标注,标注范围内用红色矩形表示。
2.1 plot画图形式修改
代码
import matplotlib.pyplot as plt
import numpy as np
# 拿起画板
fig = plt.figure()
# 贴上画纸
ax1 = fig.add_subplot(111)
# 数据准备
x_sin = np.arange(0, 6, 0.001)  # [0, 6]
y_sin = np.sin(x_sin)
data_random = np.zeros(7)  # 生成[-1,1]的7个随机数
for i in range(0, 6):
    data_random[i] = np.random.uniform(-1, 1)
# 画图
ax1.plot(x_sin, y_sin, linestyle='-', color='g', linewidth=3)
ax1.plot(data_random, linestyle='dashed', color='b', marker='o')
plt.show()
运行结果
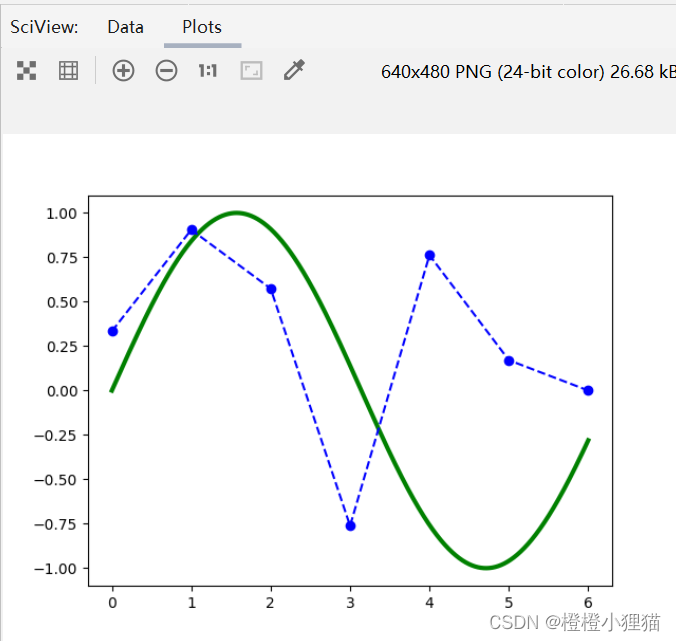
2.2 添加图例、标签等
代码
import matplotlib.pyplot as plt
import numpy as np
# 拿起画板
fig = plt.figure()
# 贴上画纸
ax1 = fig.add_subplot(111)
# 数据准备
x_sin = np.arange(0, 6, 0.001)  # [0, 6]
y_sin = np.sin(x_sin)
data_random = np.zeros(7)  # 生成[-1,1]的7个随机数
for i in range(0, 6):
    data_random[i] = np.random.uniform(-1, 1)
# 画图
ax1.plot(x_sin, y_sin, linestyle='-', color='g', linewidth=3, label='sin')
ax1.plot(data_random, linestyle='dashed', color='b', marker='o', label='random')
#-----------------添加部分------------------
# 添加标题
ax1.set_title('Title')
# 添加x轴名称
ax1.set_xlabel('x')
# 设置x轴坐标范围
ax1.set_xlim(xmin=0, xmax=6)
# 添加图例,在plot处加上label
ax1.legend(loc='best')
#----------------------------------------
plt.show()
运行结果
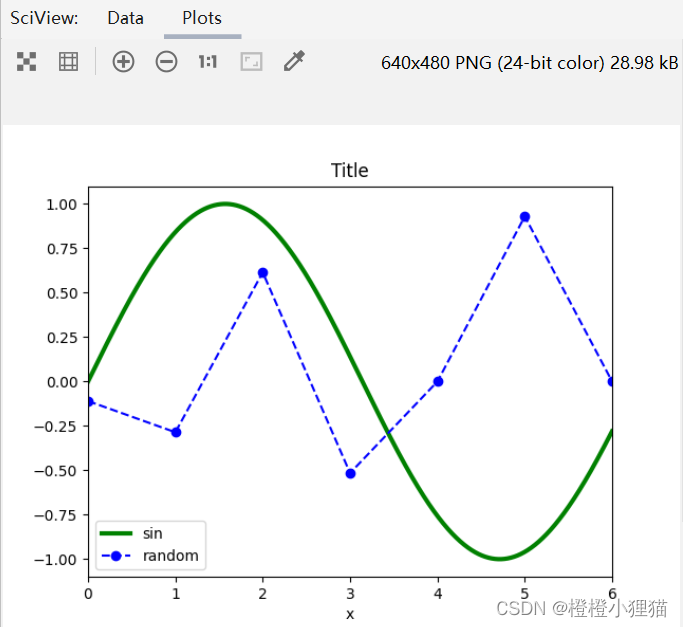
2.3 在图上画注解和矩形
代码
import matplotlib.pyplot as plt
import numpy as np
# 拿起画板
fig = plt.figure()
# 贴上画纸
ax1 = fig.add_subplot(111)
# 数据准备
x_sin = np.arange(0, 6, 0.001)  # [0, 6]
y_sin = np.sin(x_sin)
data_random = np.zeros(7)  # 生成[-1,1]的7个随机数
for i in range(0, 6):
    data_random[i] = np.random.uniform(-1, 1)
# 画图
ax1.plot(x_sin, y_sin, linestyle='-', color='g', linewidth=3, label='sin')
ax1.plot(data_random, linestyle='dashed', color='b', marker='o', label='random')
# 添加标题
ax1.set_title('Title')
# 添加x轴名称
ax1.set_xlabel('x')
# 设置x轴坐标范围
ax1.set_xlim(xmin=0, xmax=6)
# 添加图例
ax1.legend(loc='best')
#-----------------添加部分------------------
# 注解
ax1.annotate('max', xy=((np.pi) / 2, np.sin(np.pi/2)),
            xytext=((np.pi) / 2, np.sin(np.pi/2)-0.2),
            arrowprops=dict(facecolor='black', headwidth=4, width=2,headlength=4),
            horizontalalignment='left', verticalalignment='top')
ax1.annotate('min', xy=((np.pi) * 3 / 2, np.sin(np.pi * 3 / 2)),
            xytext=((np.pi) * 3 / 2, np.sin(np.pi * 3 / 2)+0.2),
            arrowprops=dict(facecolor='black', headwidth=4, width=2,headlength=4),
            horizontalalignment='left', verticalalignment='top')
# 矩形
print(ax1.axis())
rect = plt.Rectangle((np.pi / 2, ax1.axis()[2]), np.pi, ax1.axis()[3] - ax1.axis()[2], color='r', alpha=0.3)  # 起始坐标点,width, height
ax1.add_patch(rect)
#-----------------------------------------
plt.show()
运行结果
3. 图形保存
plt.savefig('figpath.png', dpi=400)
注意要放在show前面。
完整代码:
import matplotlib.pyplot as plt
import numpy as np
# 拿起画板
fig = plt.figure()
# 贴上画纸
ax1 = fig.add_subplot(221)
ax2 = fig.add_subplot(222)
ax3 = fig.add_subplot(223)
# 数据准备
x_sin = np.arange(0, 6, 0.001)  # [0, 6]
y_sin = np.sin(x_sin)
data_random = np.zeros(7)  # 生成[-1,1]的7个随机数
for i in range(0, 6):
    data_random[i] = np.random.uniform(-1, 1)
# 画图
ax1.plot(x_sin, y_sin, linestyle='-', color='g', linewidth=3, label='sin')
ax1.plot(data_random, linestyle='dashed', color='b', marker='o', label='random')
ax2.plot(x_sin, y_sin, linestyle='-', color='g', linewidth=3, label='sin')
ax2.plot(data_random, linestyle='dashed', color='b', marker='o', label='random')
ax3.plot(x_sin, y_sin, linestyle='-', color='g', linewidth=3, label='sin')
ax3.plot(data_random, linestyle='dashed', color='b', marker='o', label='random')
# # 添加标题
ax2.set_title('Title')
# 添加x轴名称
ax2.set_xlabel('x')
# 设置x轴坐标范围
ax2.set_xlim(xmin=0, xmax=6)
# 添加图例
ax2.legend(loc='best')
ax3.set_title('Title')
# 添加x轴名称
ax3.set_xlabel('x')
# 设置x轴坐标范围
ax3.set_xlim(xmin=0, xmax=6)
# 添加图例
ax3.legend(loc='best')
# 注解
ax3.annotate('max', xy=((np.pi) / 2, np.sin(np.pi/2)),
            xytext=((np.pi) / 2, np.sin(np.pi/2)-0.2),
            arrowprops=dict(facecolor='black', headwidth=4, width=2,headlength=4),
            horizontalalignment='left', verticalalignment='top')
ax3.annotate('min', xy=((np.pi) * 3 / 2, np.sin(np.pi * 3 / 2)),
            xytext=((np.pi) * 3 / 2, np.sin(np.pi * 3 / 2)+0.2),
            arrowprops=dict(facecolor='black', headwidth=4, width=2,headlength=4),
            horizontalalignment='left', verticalalignment='top')
# 矩形
# print(ax1.axis())
rect = plt.Rectangle((np.pi / 2, ax3.axis()[2]), np.pi, ax3.axis()[3] - ax3.axis()[2], color='r', alpha=0.3)  # 起始坐标点,width, height
ax3.add_patch(rect)
#-----------------添加部分------------------
plt.savefig('figpath.png', dpi=400)
#------------------------------------------
plt.show()
总结
本篇文章就到这里了,希望能够给你带来帮助,也希望您能够多多关注的更多内容!
加载全部内容