C#统计图效果
七日谭 人气:0忽然要用到C#来制作统计图,起初不太清除怎么弄,看了一些代码实现统计图的文档。终于实现了条形图的设置,后来又需要饼状图。本来还是想自己画的后来才发现C#是有这种窗体控件的,控件画比我强太多了。
这是我自己做的条形图的函数:
public static int width = 400, height = 400;//声明宽与高
Bitmap bitmap = new Bitmap(width, height);//创建一个绘图对象
//这四个参数分别是表的列名,tp1,tp2,tp3均是条形的长,s1,s2,s3代表每个条形的数据
public void createImage(string s, int tp1, int tp2,int tp3, string s1, string s2,string s3)
{
Graphics g = Graphics.FromImage(bitmap);
g.FillRectangle(Brushes.Black, 0, 0, 400, 400);//边框
try
{
g.Clear(Color.White);
//创建6个brush,用于填充颜色
Brush brush1 = new SolidBrush(Color.White);
Brush brush2 = new SolidBrush(Color.Black);
Brush brush3 = new SolidBrush(Color.Red);
Brush brush4 = new SolidBrush(Color.Green);
Brush brush5 = new SolidBrush(Color.Orange);
Brush brush6 = new SolidBrush(Color.DarkBlue);
//创建两个Font对象,用于设置字体
Font font1 = new Font("宋体", 16, FontStyle.Bold);
Font font2 = new Font("Courier New", 8);
g.FillRectangle(brush1, 0, 0, width, height);//绘制背景图
g.DrawString(s, font1, brush2, new Point(90, 20));//绘制标题
Point p1 = new Point(30, 300);
Point p2 = new Point(330, 300);
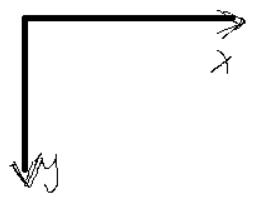
//这里用到的减式是由于画布的坐标系和数学中的坐标系不同,参考下面的图
g.DrawString(s1, font2, brush2, new Point(90, 285 - (tp1 * 10)));
g.DrawString(s2, font2, brush2, new Point(150, 285 - (tp2 * 10)));
g.DrawString(s2, font2, brush2, new Point(210, 285 - (tp3 * 10)));
g.FillRectangle(brush3, 90, 300 - (tp1 * 10), 50, tp1 * 10);//
g.FillRectangle(brush4, 150, 300 - (tp2 * 10), 50, tp2 * 10);//
g.FillRectangle(brush5, 210, 300 - (tp3 * 10), 50, tp3 * 10);
g.DrawLine(new Pen(Color.Black), p1, p2);//绘制一条直线
pictureBox1.Image = bitmap;
}
catch (Exception)
{
throw;
}
}画布中的坐标系:
如果换成C#中的chart控件来做就简单多了
1.找到控件的Legends属性把其中的Enabled改成False。
2.找到控件的Series属性把其中的ChartType改成你需要的表形式。
3.接下就是为chart控件添加数据。
添加数据的方式之一:
string[] xData = { "经理", "总监", "销售" };
  int[] yData = {10, 20, 30};
  chart1.Series[0]["PieLabelStyle"] = "Outside";//将文字移到外侧
  chart1.Series[0]["PieLineColor"] = "Black";//绘制黑色的连线。
  chart1.Series[0].Points.DataBindXY(xData, yData);
加载全部内容