python colomap颜色范围
oceanography-Rookie 人气:0python 如何取出colormap中的部分色标
平常我们在绘制填色图时,经常会使用到各种colormap,但是python提供的一些 colormap色标有时候不那么合适,需要我们裁剪一下进行使用。
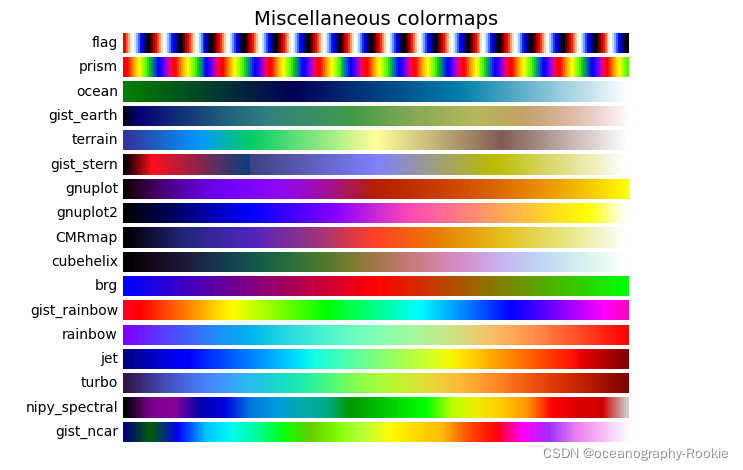
官网colormap例子链接如下:
colormap

本文提供了一种方法,可以提取colormap色标中的一部分,取出我们满意的色标区域。下面以jet为例,进行演示
import matplotlib.pyplot as plt
from mpl_toolkits.axes_grid1 import make_axes_locatable
import numpy as np
from matplotlib.colors import ListedColormap, LinearSegmentedColormap
ax = plt.subplot()
cmap=plt.get_cmap('jet')
newcolors=cmap(np.linspace(0, 1, 256))
newcmap = ListedColormap(newcolors[57:245])
im = ax.imshow(np.arange(100).reshape((10, 10)),cmap=newcmap)
# create an axes on the right side of ax. The width of cax will be 5%
# of ax and the padding between cax and ax will be fixed at 0.05 inch.
divider = make_axes_locatable(ax)
cax = divider.append_axes("right", size="5%", pad=0.05)
plt.colorbar(im, cax=cax)
plt.show()
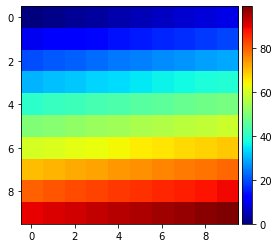
未改变前:

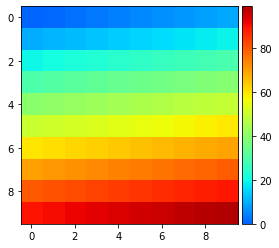
修改后:

加载全部内容