Matlab桑基图
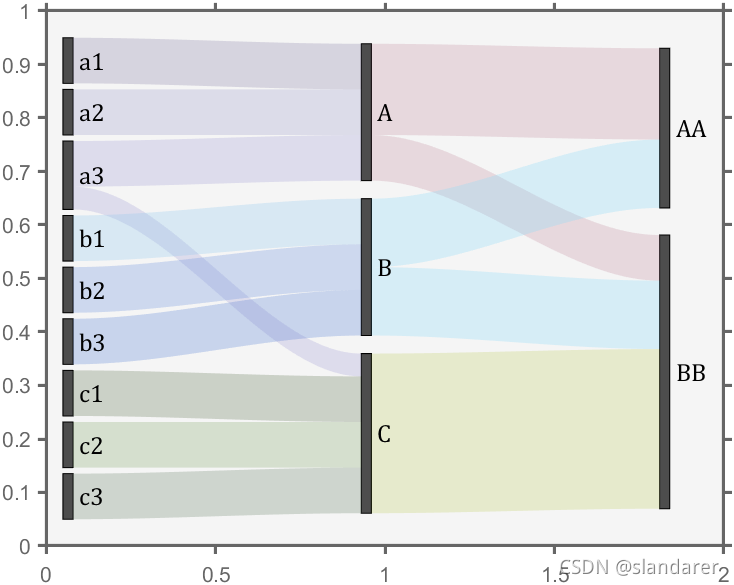
slandarer 人气:0这次主要是分享自己写的一个函数,用来绘制桑基图,效果大概是下面这样子:
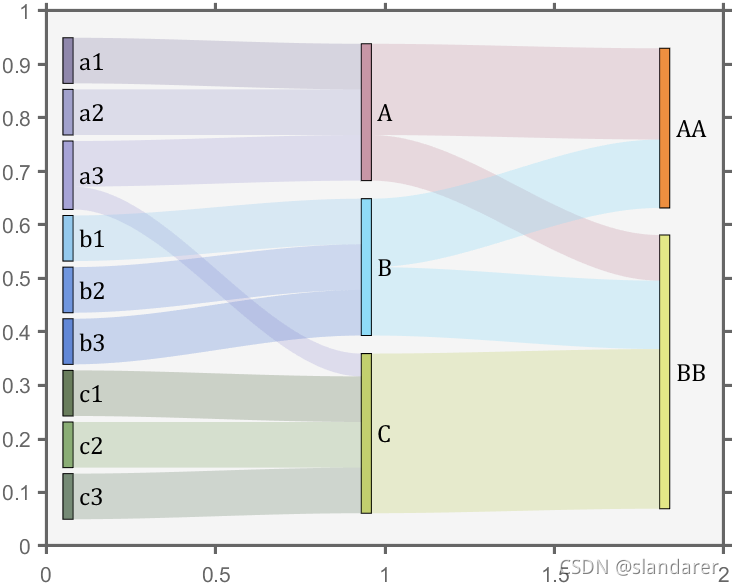
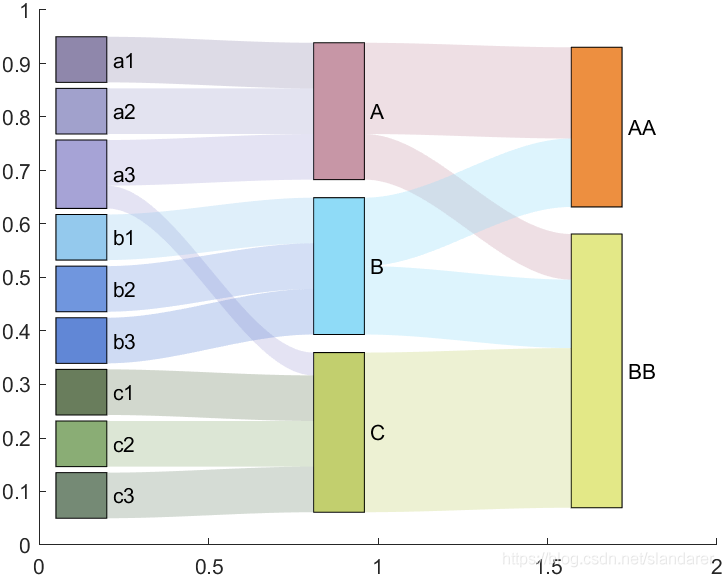
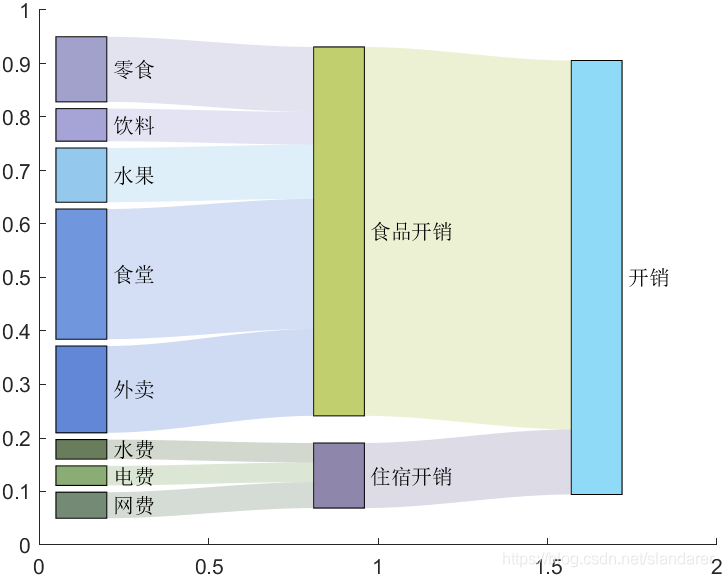
先说明函数(sankey2)怎么用,函数完整代码放在博客最后
详细用法
1 使用示例
新建一个m文件,运行如下代码
List={'a1',1,'A';
      'a2',1,'A';
      'a3',1,'A';
      'a3',0.5,'C';
      'b1',1,'B';
      'b2',1,'B';
      'b3',1,'B';
      'c1',1,'C';
      'c2',1,'C';
      'c3',1,'C';
      'A',2,'AA';
      'A',1,'BB';
      'B',1.5,'BB';
      'B',1.5,'AA';
      'C',3.5,'BB';
      };
axis([0,2,0,1])
sankeyHdl=sankey2([],'XLim',[0,2],'YLim',[0,1],'PieceWidth',0.15,'List',List,'Color',[0.3,0.3,0.7])

2 输入参数
2.1 必要输入参数
必要参数一共有四个,第一个就是流量表(‘List’),可以从excel里导入,也可以像下图这样直接写在cell数组里:
List={'a1',1,'A';
      'a2',1,'A';
      'a3',1,'A';
      'a3',0.5,'C';
      'b1',1,'B';
      'b2',1,'B';
      'b3',1,'B';
      'c1',1,'C';
      'c2',1,'C';
      'c3',1,'C';
      'A',2,'AA';
      'A',1,'BB';
      'B',1.5,'BB';
      'B',1.5,'AA';
      'C',3.5,'BB';
      };
另外三个参数为,x轴范围(‘xLim’),y轴范围(‘YLim’),以及函数第一个参数,要绘制图像的axes,要画在当前窗口可以将第一个参数写作[]或者gca
2.2 修饰参数
主要有以下几个,不写时用省缺值替换
- Color 方块颜色
- EdgeColor 方块边缘颜色
- FontSize 字号
- FontColor 字体颜色
- PieceWidth 方块宽度
- Margin 桑基图距离边缘距离
- Sep 纵向空白占方块总长度比例
其中Color可以是个nx3大小的矩阵,矩阵中数值范围为[0,1],例如:
List={'a1',1,'A';
      'a2',1,'A';
      'a3',1,'A';
      'a3',0.5,'C';
      'b1',1,'B';
      'b2',1,'B';
      'b3',1,'B';
      'c1',1,'C';
      'c2',1,'C';
      'c3',1,'C';
      'A',2,'AA';
      'A',1,'BB';
      'B',1.5,'BB';
      'B',1.5,'AA';
      'C',3.5,'BB';
      };
axis([0,2,0,1])
colorList=[0.4600    0.5400    0.4600
    0.5400    0.6800    0.4600
    0.4100    0.4900    0.3600
    0.3800    0.5300    0.8400
    0.4400    0.5900    0.8700
    0.5800    0.7900    0.9300
    0.6500    0.6400    0.8400
    0.6300    0.6300    0.8000
    0.5600    0.5300    0.6700
    0.7600    0.8100    0.4300
    0.5600    0.8600    0.9700
    0.7800    0.5900    0.6500
    0.8900    0.9100    0.5300
    0.9300    0.5600    0.2500];
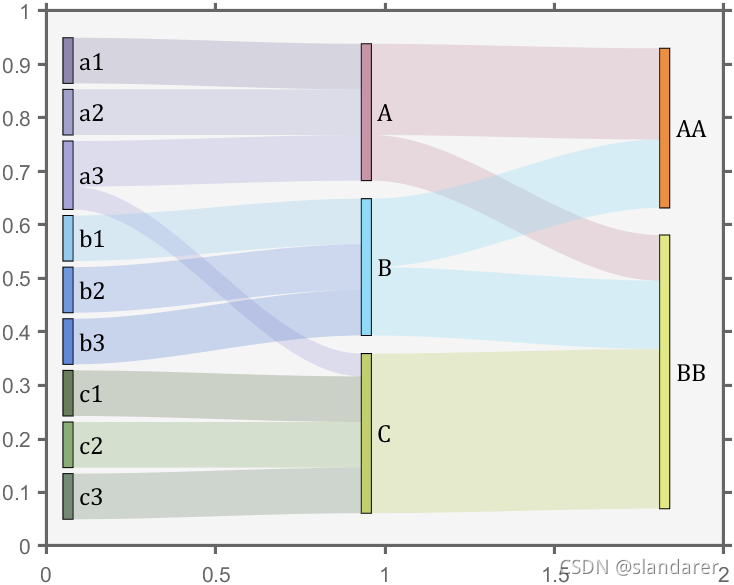
sankeyHdl=sankey2([],'XLim',[0,2],'YLim',[0,1],'PieceWidth',0.15,'List',List,'Color',colorList)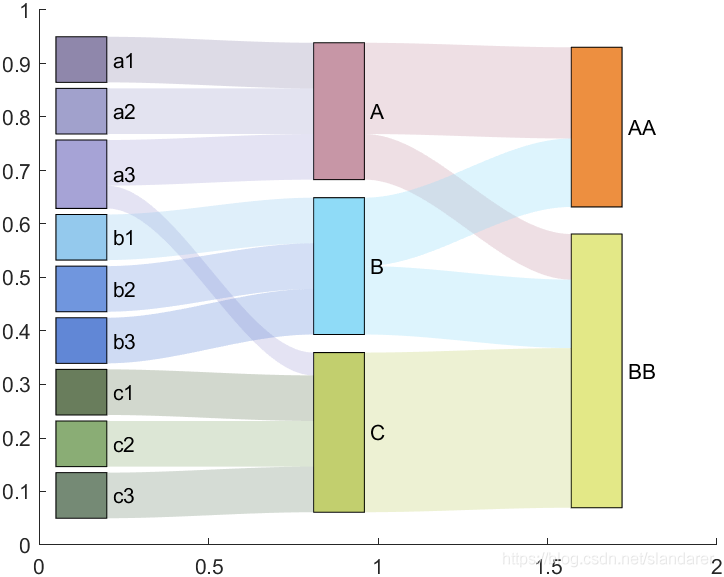
3 输出
函数的输出如下:

nameList就是每一个元素的名称,block是每一个方块的图形对象,connect是每一个连接的图形对象,txt是每一个标签的文本对象,我们可以做出以下操作:
图形对象和文本对象原本自带的属性依旧可以用(颜色,位置,透明度,边缘粗细等等)
假设我们编写了如下代码的基础上,我们尝试对对象进行操作:
List={'a1',1,'A';
      'a2',1,'A';
      'a3',1,'A';
      'a3',0.5,'C';
      'b1',1,'B';
      'b2',1,'B';
      'b3',1,'B';
      'c1',1,'C';
      'c2',1,'C';
      'c3',1,'C';
      'A',2,'AA';
      'A',1,'BB';
      'B',1.5,'BB';
      'B',1.5,'AA';
      'C',3.5,'BB';
      };
axis([0,2,0,1])
sankeyHdl=sankey2([],'XLim',[0,2],'YLim',[0,1],'PieceWidth',0.15,'List',List,'Color',colorList)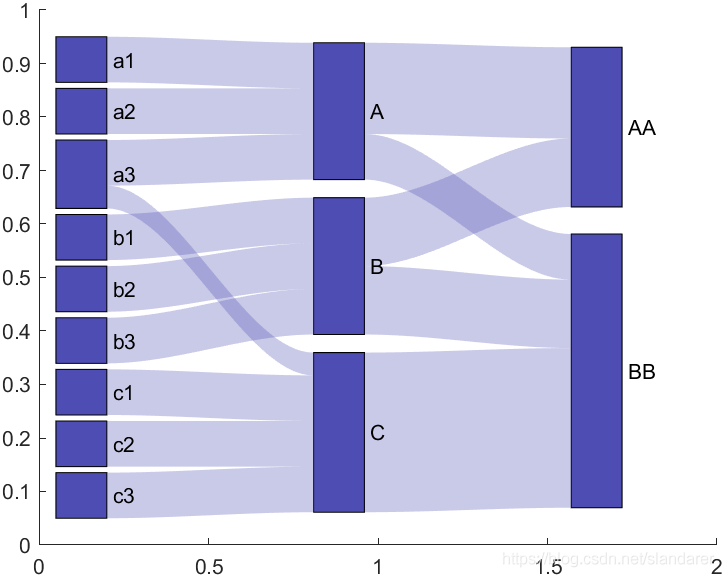
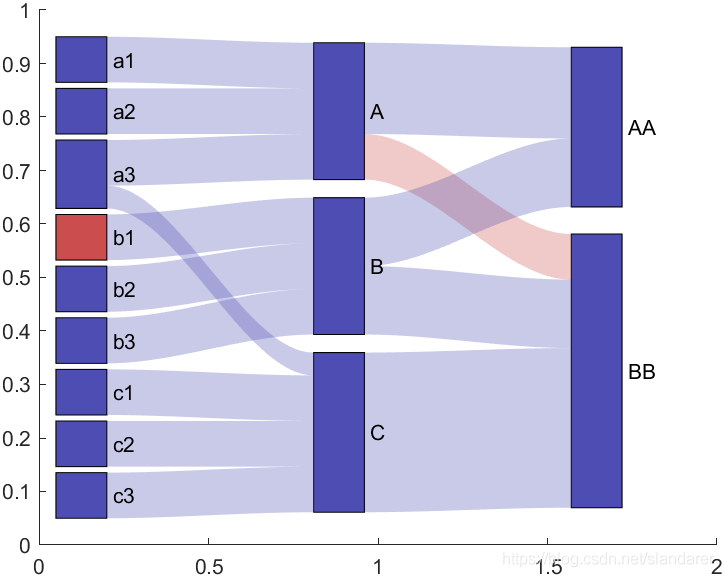
操作1 把第四个方块颜色变为红色
sankeyHdl.block(4).FaceColor=[0.8,0.3,0.3];

操作2 把第10个方块的第一个连接变为红色
sankeyHdl.connect(10,1).FaceColor=[0.8,0.3,0.3];
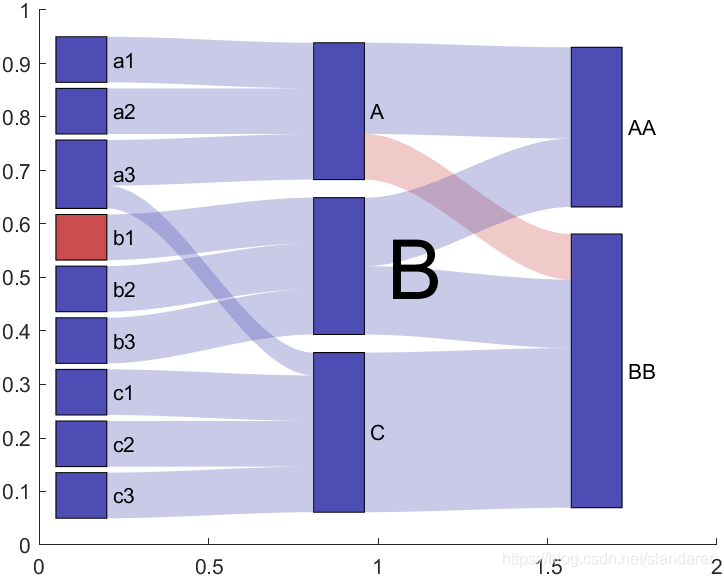
操作3 把第11个标签文本放大
sankeyHdl.txt(11).FontSize=40;
函数完整代码
function sankeyHdl=sankey2(varargin)
if strcmp(get(varargin{1},'type'),'axes' )
    ax=varargin{1};
else
    ax=gca;
end
hold(ax,'on')

%若未设置,则图像的初始值==================================================
prop.Color=[0,0,0];
prop.FontSize=10;
prop.FontColor=[0,0,0];
prop.Xlim=[0,1];
prop.YLim=[0,1];
prop.PieceWidth=0.15;
prop.List=[];
prop.Margin=0.05;
prop.Sep=1/8;
prop.EdgeColor=[0 0 0];

%从可变长度变量中提取有用信息==============================================
for i=1:length(varargin)
    tempVar=varargin{i};
    if ischar(tempVar)&&length(tempVar)>1
        prop.(tempVar)=varargin{i+1};
    end
end

%流量矩阵构建==============================================================
nameList=unique([prop.List(:,1);prop.List(:,3)],'stable');
blockMat=zeros(length(nameList));
for i=1:size(prop.List,1)
    s=strcmp(nameList,prop.List(i,1));
    e=strcmp(nameList,prop.List(i,3));
    blockMat(s,e)=prop.List{i,2};
end
totalFlow=max([sum(blockMat,1);sum(blockMat,2)'],[],1);


%划分桑基图层次============================================================
List_L=prop.List(:,1);
List_R=prop.List(:,3);
prop.layer=[];layerRoot=[];n=1;
for i=length(List_R):-1:1
    if ~any(strcmp(List_L,List_R{i}))
        layerRoot=[layerRoot;find(strcmp(nameList,List_R{i}))];
    end
end
layerRoot=unique(layerRoot,'stable');
while ~isempty(List_L)
    layer_n=[];
    for i=length(List_L):-1:1
        if ~any(strcmp(List_R,List_L{i}))
            layer_n=[layer_n;find(strcmp(nameList,List_L{i}))];
            List_L(i)=[];
            List_R(i)=[];
        end
    end
    layer_n=unique(layer_n,'stable');
    prop.layer(length(layer_n),n)=0;
    prop.layer(1:length(layer_n),n)=layer_n;
    n=n+1;
end
prop.layer(length(layerRoot),n)=0;
prop.layer(1:length(layerRoot),n)=layerRoot;
prop.layerNum=size(prop.layer,2);


%绘制方块==================================================================
baseBlockX=[0,1,1,0];
baseBlockY=[0,0,1,1];
bnul=max(sum(prop.layer~=0,1));   %block number upper limit
baseLenY=(diff(prop.YLim)-2*prop.Margin)/(bnul+(bnul-1)*prop.Sep)*bnul;
baseLenX=(diff(prop.XLim)-2*prop.Margin)/(prop.layerNum-0.5);
colorIndex=1;
for i=1:prop.layerNum
    tempY=prop.Margin;
    elemSet=prop.layer(prop.layer(:,i)~=0,i);
    flowSet=totalFlow(elemSet);
    offSet=(diff(prop.YLim)-2*prop.Margin-baseLenY/length(elemSet)*((length(elemSet)+(length(elemSet)-1)*prop.Sep)))/2;
    for j=1:length(elemSet)
        tempLenY=baseLenY./sum(flowSet).*flowSet(j);

        sankeyHdl.block(prop.layer(j,i))=...
        fill(baseBlockX.*prop.PieceWidth+prop.Margin+(i-1)*baseLenX,...
            baseBlockY.*tempLenY+tempY+offSet,...
            prop.Color(colorIndex,:),'EdgeColor',prop.EdgeColor);

        tempY=tempY+tempLenY+baseLenY/length(elemSet)*prop.Sep;
        colorIndex=mod(colorIndex,size(prop.Color,1))+1;
    end
end

%绘制连接
layerList=prop.layer(:);
for i=1:length(nameList)
    for j=i:length(nameList)
        if blockMat(i,j)~=0
            Hdl_L=sankeyHdl.block(i);
            Hdl_R=sankeyHdl.block(j);
            list_L=find(blockMat(i,:)~=0);
            list_R=find(blockMat(:,j)~=0);
            [~,pl,~]=intersect(layerList,list_L(:));
            [~,pr,~]=intersect(layerList,list_R(:));
            list_L=layerList(sort(pl));
            list_R=layerList(sort(pr));
            flow_L=blockMat(i,list_L);
            flow_R=blockMat(list_R,j);
            XData_L=Hdl_L.XData;YData_L=Hdl_L.YData;
            XData_R=Hdl_R.XData;YData_R=Hdl_R.YData;
            xx=[XData_L(1:2);XData_R(1:2)]';
            k_L=find(list_L==j);
            k_R=find(list_R==i);
            yy=[YData_L(1:2)+(YData_L(3:4)-YData_L(1:2))./sum(flow_L).*sum(flow_L(1:k_L-1));
                YData_R(1:2)+(YData_R(3:4)-YData_R(1:2))./sum(flow_R).*sum(flow_R(1:k_R-1))]';
            xxq=XData_L(2):0.01:XData_R(1);
            yyq=interp1(xx,yy,xxq,'pchip');
            tempColor=Hdl_L.FaceColor;
            width=(YData_R(3)-YData_R(1))./sum(flow_R).*flow_R(k_R);
             sankeyHdl.connect(i,k_L)=...
            fill([xxq,xxq(end:-1:1)],[yyq,yyq(end:-1:1)+width],tempColor,'EdgeColor','none','FaceAlpha',0.3);
        end
    end
end

%绘制文本
for i=1:prop.layerNum
    tempY=prop.Margin;
    elemSet=prop.layer(prop.layer(:,i)~=0,i);
    flowSet=totalFlow(elemSet);
    offSet=(diff(prop.YLim)-2*prop.Margin-baseLenY/length(elemSet)*((length(elemSet)+(length(elemSet)-1)*prop.Sep)))/2;
    for j=1:length(elemSet)
        tempLenY=baseLenY./sum(flowSet).*flowSet(j);

        sankeyHdl.txt(prop.layer(j,i))=...
        text(prop.PieceWidth+prop.Margin+(i-1)*baseLenX,tempLenY/2+tempY+offSet,[' ',nameList{elemSet(j)}],...
            'FontSize',prop.FontSize,'Color',prop.FontColor);

        tempY=tempY+tempLenY+baseLenY/length(elemSet)*prop.Sep;
    end
end
sankeyHdl.nameList=nameList';
end
使用示例代码
List={'零食',300,'食品开销';
      '饮料',150,'食品开销';
      '水果',250,'食品开销';
      '食堂',600,'食品开销';
      '外卖',400,'食品开销';
      '水费',90,'住宿开销';
      '电费',90,'住宿开销';
      '网费',120,'住宿开销';
      '食品开销',1700,'开销';
      '住宿开销',300,'开销'};
axis([0,2,0,1])
sankeyHdl=sankey2([],'XLim',[0,2],'YLim',[0,1],'PieceWidth',0.15,'List',List,'Color',colorList)

sankeyHdl.block(4).FaceColor=[0.8,0.3,0.3];
sankeyHdl.txt(4).FontSize=40;
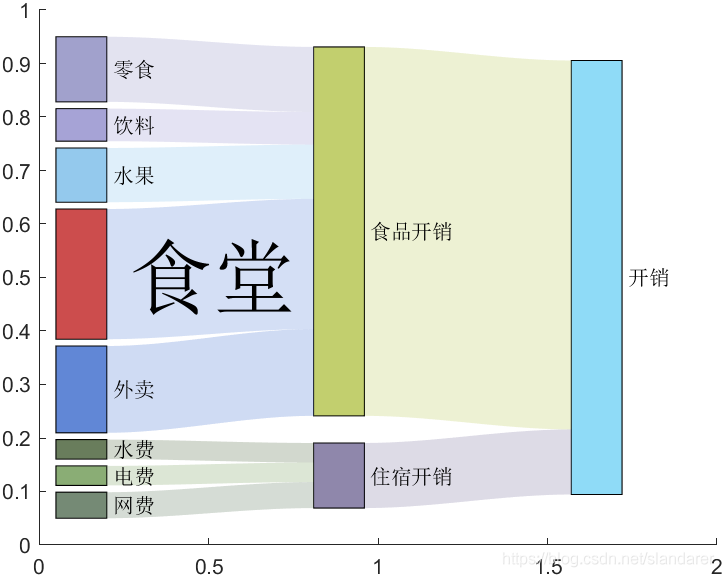
试试证明还是方块画细一点显得高级,修饰一下:
加载全部内容