ggplot绘制置信区间与分组绘图 R语言数据可视化ggplot绘制置信区间与分组绘图技巧
Kanny广小隶 人气:51. 单组情况
1)构造数据集
x <- 1:10
y <- x^2
ci_l <- x^2 - 0.5 * x
ci_r <- x^2 + 0.5 * x

dat_plot <- data.frame(x, y, ci_l, ci_r)
数据集长下面这样:
    x   y ci_l  ci_r
1   1   1  0.5   1.5
2   2   4  3.0   5.0
3   3   9  7.5  10.5
4   4  16 14.0  18.0
5   5  25 22.5  27.5
6   6  36 33.0  39.0
7   7  49 45.5  52.5
8   8  64 60.0  68.0
9   9  81 76.5  85.5
10 10 100 95.0 105.0
2)绘制置信区间
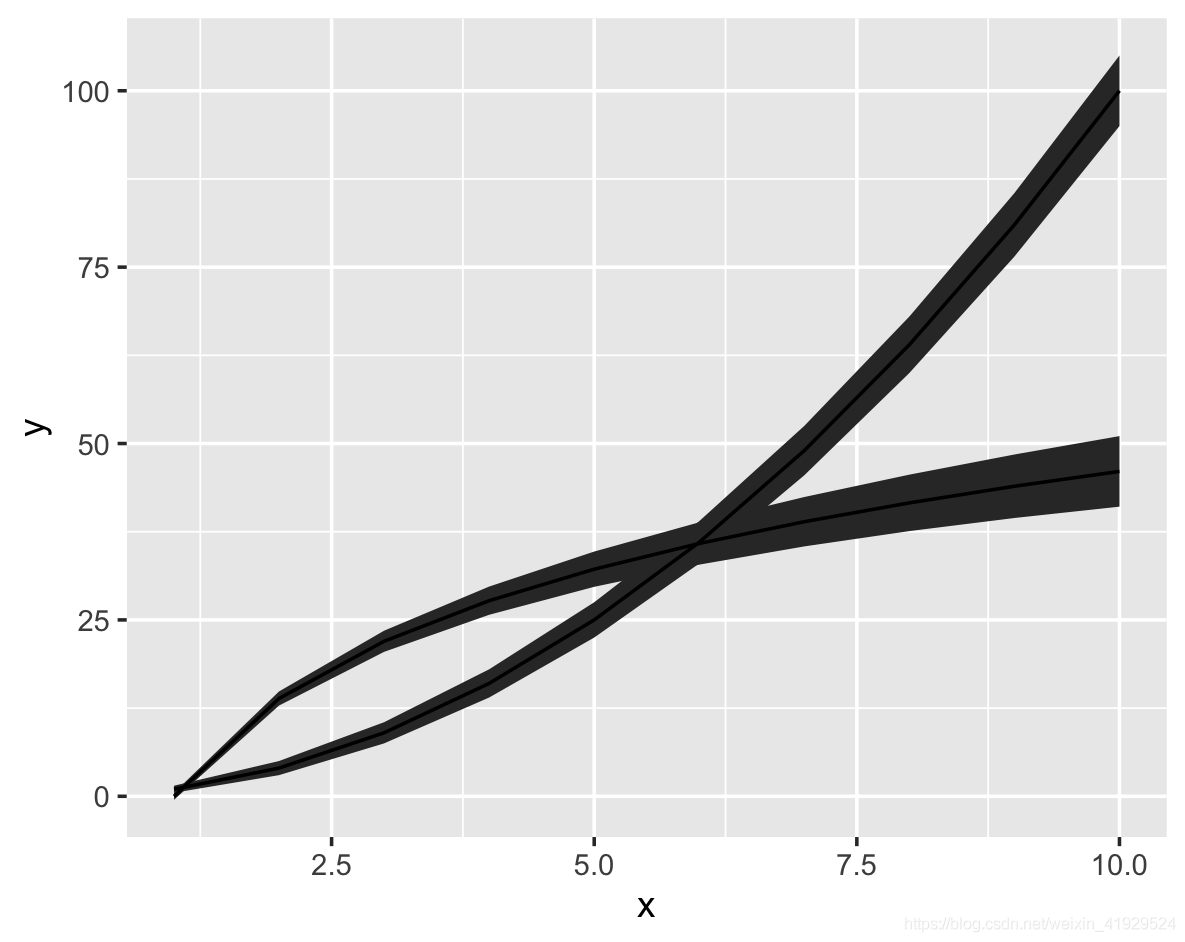
添加置信区间的核心函数是:geom_ribbon(),并且要注意,先画置信区间,再绘制线条,才能保证线在置信区间的上方。
ggplot(dat_plot, aes(x = x)) +                  # x轴在此处添加,目的为了置信区间与拟合线共享同一个x
  geom_ribbon(aes(ymin = ci_l, ymax = ci_r)) +  # 添加置信区间
  geom_line(aes(y = y))                         # 添加拟合线

(文末会对上面“丑丑”的置信区间进行美化。)
通常情况,所需的图片都是需要分组的,下面我们会进行分组绘制置信区间。
2. 多组情况
我们将会演示两种方式绘制分组情况绘制置信区间:
方法1
1)构造数据集
通常情况下,ggplot需要的向量化构造:
x <- 1:10
y1 <- x^2
ci_l1 <- x^2 - 0.5 * x
ci_r1 <- x^2 + 0.5 * x

y2 <- 20 * log(x)
ci_l2 <- 20 * log(x) - 0.5 * x
ci_r2 <- 20 * log(x) + 0.5 * x

dat_plot <- data.frame(rbind(cbind(x, y1, ci_l1, ci_r1), cbind(x, y2, ci_l2, ci_r2)))
names(dat_plot) <- c("x", "y", "ci_l", "ci_r")
dat_plot$group <- rep(c("G1", "G2"), each = 10)
数据样式:
    x         y     ci_l      ci_r group
1   1   1.00000  0.50000   1.50000    G1
2   2   4.00000  3.00000   5.00000    G1
3   3   9.00000  7.50000  10.50000    G1
4   4  16.00000 14.00000  18.00000    G1
5   5  25.00000 22.50000  27.50000    G1
6   6  36.00000 33.00000  39.00000    G1
7   7  49.00000 45.50000  52.50000    G1
8   8  64.00000 60.00000  68.00000    G1
9   9  81.00000 76.50000  85.50000    G1
10 10 100.00000 95.00000 105.00000    G1
11  1   0.00000 -0.50000   0.50000    G2
12  2  13.86294 12.86294  14.86294    G2
13  3  21.97225 20.47225  23.47225    G2
14  4  27.72589 25.72589  29.72589    G2
15  5  32.18876 29.68876  34.68876    G2
16  6  35.83519 32.83519  38.83519    G2
17  7  38.91820 35.41820  42.41820    G2
18  8  41.58883 37.58883  45.58883    G2
19  9  43.94449 39.44449  48.44449    G2
20 10  46.05170 41.05170  51.05170    G2
2)绘制置信区间
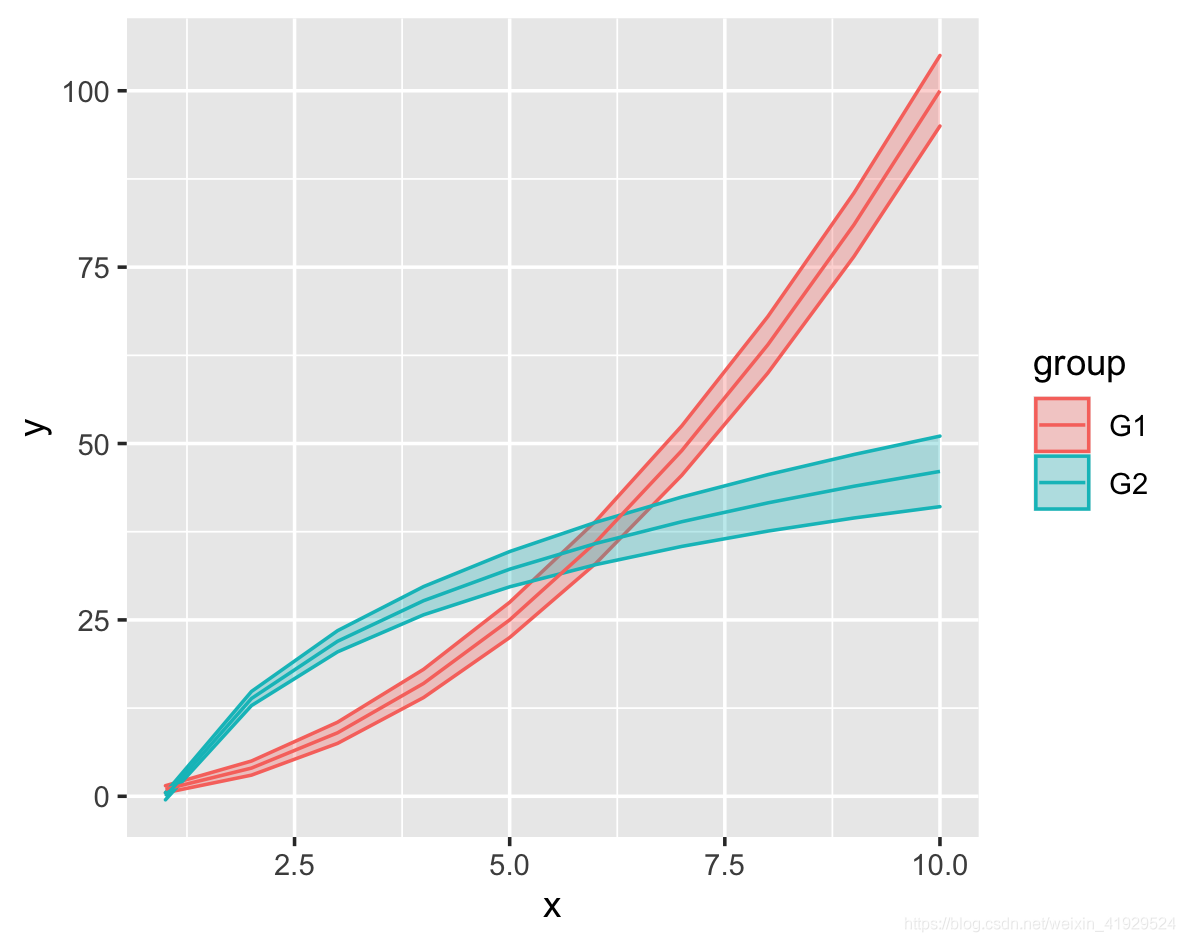
注意,这里分组的关键就是使用 group = 参数。
ggplot(dat_plot, aes(x = x, group = group)) +
  geom_ribbon(aes(ymin = ci_l, ymax = ci_r)) +
  geom_line(aes(y = y))

但是这里的颜色比较吃藕,所以我们改变一下线条的颜色与置信区间的颜色。
非常简单,我们将参数 group = 用 color = 与 fill = 替换即可。值得一提的是,这里的color = 如果加在ggplot()中,添加的就会是拟合线与置信区间外边线两条曲线。若不想要置信区间的外边线, color =写在geom_line()中即可。
此外,还需要注意,绘制置信区间,若线条与区间是相同颜色,一定要修改置信区间的透明度,利用alpha = 进行修改,其范围在0-1之间,并且值越小越透明。
代码如下:
ggplot(dat_plot, aes(x = x, color = group, fill = group)) +
  geom_ribbon(aes(ymin = ci_l, ymax = ci_r), alpha = 0.3) +  # alpha 修改透明度
  geom_line(aes(y = y))

在大多数情况下,我们遇到的多组数据集长下面 方法2 这样,我们需要怎么进行绘制呢?下面继续进行讲解:
方法2
1)构造数据集
dat_plot <- data.frame(x, y1, ci_l1, ci_r1, y2, ci_l2, ci_r2) # 基于前文的数据
    x  y1 ci_l1 ci_r1       y2    ci_l2    ci_r2
1   1   1   0.5   1.5  0.00000 -0.50000  0.50000
2   2   4   3.0   5.0 13.86294 12.86294 14.86294
3   3   9   7.5  10.5 21.97225 20.47225 23.47225
4   4  16  14.0  18.0 27.72589 25.72589 29.72589
5   5  25  22.5  27.5 32.18876 29.68876 34.68876
6   6  36  33.0  39.0 35.83519 32.83519 38.83519
7   7  49  45.5  52.5 38.91820 35.41820 42.41820
8   8  64  60.0  68.0 41.58883 37.58883 45.58883
9   9  81  76.5  85.5 43.94449 39.44449 48.44449
10 10 100  95.0 105.0 46.05170 41.05170 51.05170
2)绘制置信区间
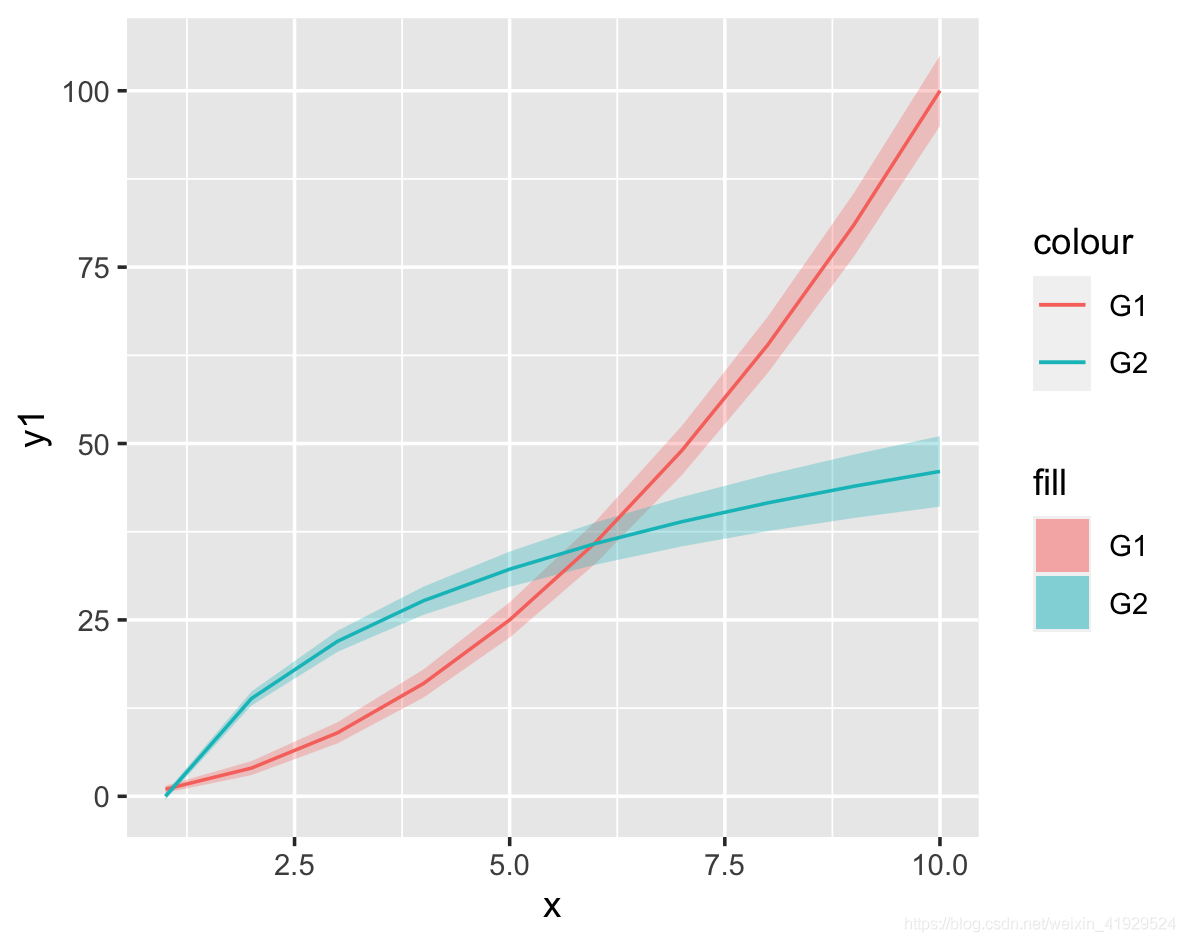
面对上述这种数据格式,我们处理起来也十分简单,我们只需要在对应的aes() 函数中,写清楚对应的分组名称即可。
color = 与 fill = 一定要写在 aes() 里面!!!
color = 与 fill = 一定要写在 aes() 里面!!!
color = 与 fill = 一定要写在 aes() 里面!!!
重要的事情说三遍,具体代码如下所示:
ggplot(dat_plot, aes(x = x)) +
  geom_ribbon(aes(ymin = ci_l1, ymax = ci_r1, fill = "G1"), alpha = 0.3) +
  geom_ribbon(aes(ymin = ci_l2, ymax = ci_r2, fill = "G2"), alpha = 0.3) +
  geom_line(aes(y = y1, color = "G1")) +
  geom_line(aes(y = y2, color = "G2"))

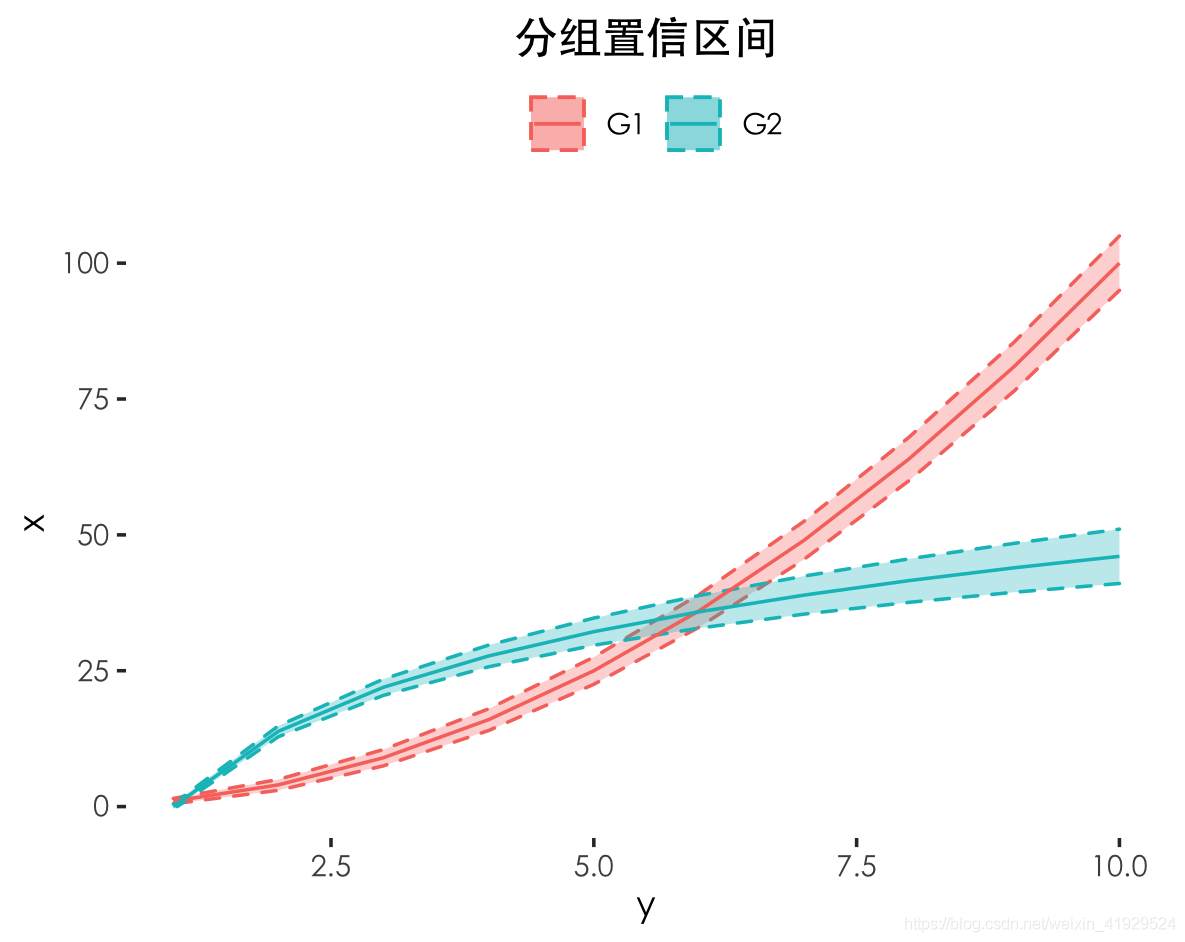
但这样的置信区间还比较丑,下面我们给出一个略微美化的版本,并在代码中进行注释,说明每个函数的用意。
3)美化
ggplot(dat_plot, aes(x = x)) +
  geom_ribbon(aes(ymin = ci_l1, ymax = ci_r1, fill = "G1", color = "G1"),
              alpha = 0.3, linetype = 2) +        # linetype = 2 表示置信区间描边线为虚线
  geom_ribbon(aes(ymin = ci_l2, ymax = ci_r2, fill = "G2", color = "G2"),
              alpha = 0.3, linetype = 2) +
  geom_line(aes(y = y1, color = "G1")) +
  geom_line(aes(y = y2, color = "G2")) +
  theme_bw(base_family = "Times") +
  theme(panel.grid = element_blank(),
    legend.position = "top",                      # legend 置顶
    panel.border = element_blank(),
    text = element_text(family = "STHeiti"),      # Mac 系统中中文绘图
    plot.title = element_text(hjust = 0.5)) +     # 标题居中
  labs(x = "y", y = "x", title = "分组置信区间",
       color = "", fill = "")                      # 将置信区间与拟合线的 legend 合并,并且不要 legend 的小标题

想学习更多 ggplot 美化绘图的技巧,可以参考下述链接:
ggplot2:初次见面,请多多关照!
加载全部内容
 爱之家商城
爱之家商城 氢松练
氢松练 Face甜美相机
 花汇通
花汇通 走路宝正式版
 天天运动有宝
 深圳plus
 热门免费小说