matplotlib xticks用法 基于matplotlib xticks用法详解
chuang94 人气:2这个坐标轴变名用法,我真服气了,我在网上看大家写的教程,看的头晕,也没看懂他们写xtick到底怎么用的,最后找到官方教程,看了一个例子,over
xticks到底有什么用,其实就是想把坐标轴变成自己想要的样子
import matplotlib.pyplot as plt


x = [1, 2, 3, 4]
y = [1, 4, 9, 6]
labels = ['Frogs', 'Hogs', 'Bogs', 'Slogs']

plt.plot(x, y)
# You can specify a rotation for the tick labels in degrees or with keywords.
plt.xticks(x, labels, rotation='vertical')
# Pad margins so that markers don't get clipped by the axes
plt.margins(0.2)
# Tweak spacing to prevent clipping of tick-labels
plt.subplots_adjust(bottom=0.15)
plt.show()
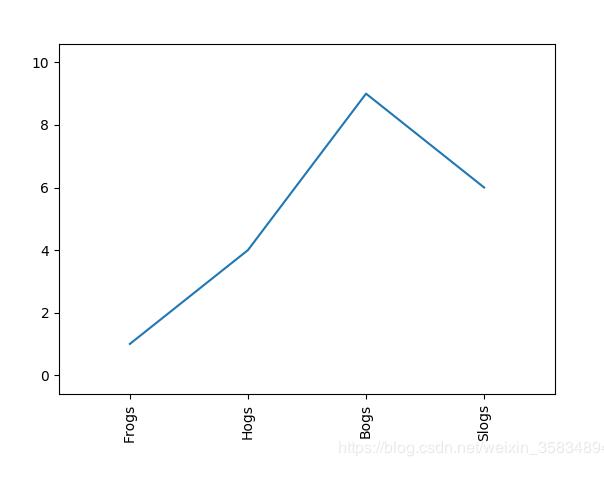
我们看下结果

大家看,坐标轴变成了我们想要的样子,那么这个代码是怎么实现的了
其实非常简单,先画图,然后改变坐标轴名字
其实xticks就类似覆盖吧,而且覆盖的数组长度要和原来横轴的坐标长度一致
补充知识:plt.xticks中的参数代表的含义与scatter等函数中的变量的意义
plt.xticks([0,1],[1,2],rotation=0)
[0,1]代表x坐标轴的0和1位置,[2,3]代表0,1位置的显示lable,rotation代表lable显示的旋转角度。
values=data[‘values']
plt.scatter(values[:,0],values[:,2],marker=‘o')#以数据的第零列做x轴,第三列做y轴,来描绘散点图
以上这篇基于matplotlib xticks用法详解就是小编分享给大家的全部内容了,希望能给大家一个参考,也希望大家多多支持。
加载全部内容