python3实现绘制二维点图
人气:5如下所示:
import matplotlib.pyplot as plt
plt.plot([1,2,3],[4,5,6],'ro')
plt.show()#这个智障的编辑器,,,看来高版本的确修复了一些bug
用python3的qt5出来的图形,效果很好:

而且在上面的图像中也可以用调整按钮进行适当的调整。
下面我们直接用代码进行坐标的调整:
import matplotlib.pyplot as plt
plt.xlim(xmax=7,xmin=0)
plt.ylim(ymax=7,ymin=0)
plt.plot([1,2,3],[4,5,6],'ro')
plt.show()

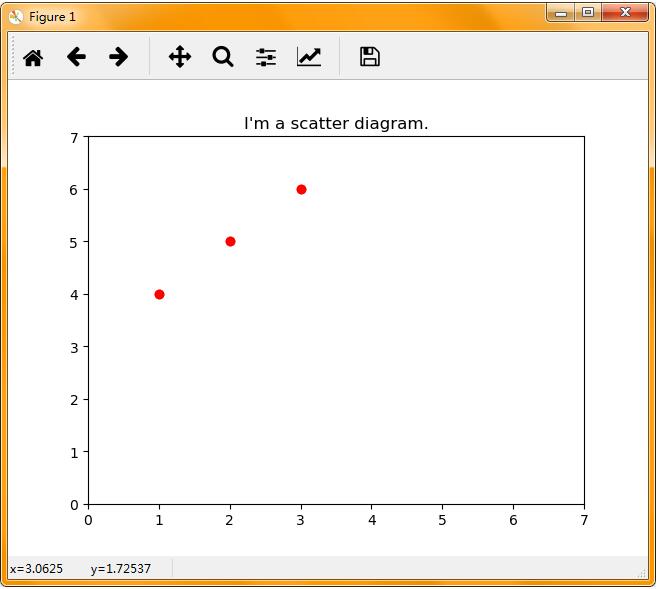
下面加一个标题,叫做散点图
import matplotlib.pyplot as plt
plt.title("I'm a scatter diagram.")
plt.xlim(xmax=7,xmin=0)
plt.ylim(ymax=7,ymin=0)
plt.plot([1,2,3],[4,5,6],'ro')
plt.show()

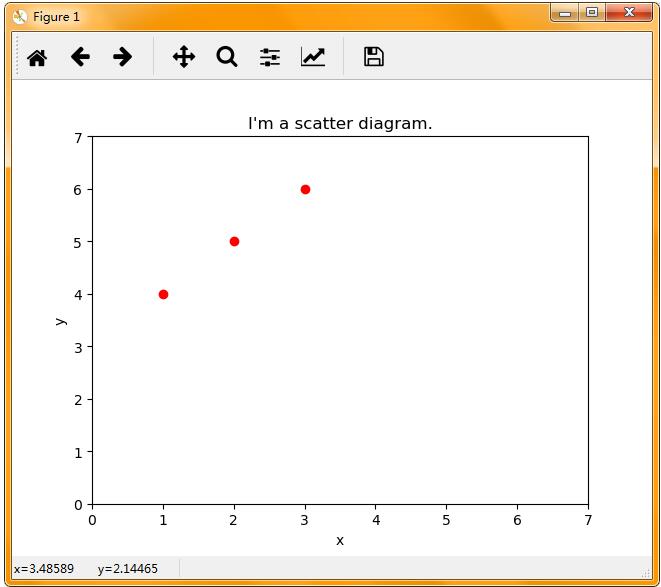
给xy轴进行命名
import matplotlib.pyplot as plt
plt.title("I'm a scatter diagram.")
plt.xlim(xmax=7,xmin=0)
plt.ylim(ymax=7,ymin=0)
plt.xlabel("x")
plt.ylabel("y")
plt.plot([1,2,3],[4,5,6],'ro')
plt.show()

加一个标注:
import matplotlib.pyplot as plt
plt.title("I'm a scatter diagram.")
plt.xlim(xmax=7,xmin=0)
plt.ylim(ymax=7,ymin=0)
plt.annotate("(3,6)", xy = (3, 6), xytext = (4, 5), arrowprops = dict(facecolor = 'black', shrink = 0.1))
plt.xlabel("x")
plt.ylabel("y")
plt.plot([1,2,3],[4,5,6],'ro')
plt.show()

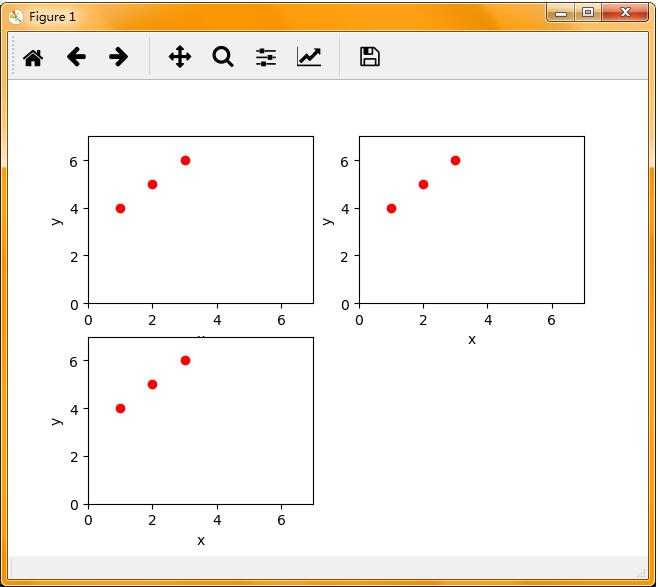
多画几个图:
import matplotlib.pyplot as plt

plt.subplot(221)
plt.xlim(xmax=7,xmin=0)
plt.ylim(ymax=7,ymin=0)
plt.xlabel("x")
plt.ylabel("y")
plt.plot([1,2,3],[4,5,6],'ro')

plt.subplot(222)
plt.xlim(xmax=7,xmin=0)
plt.ylim(ymax=7,ymin=0)
plt.xlabel("x")
plt.ylabel("y")
plt.plot([1,2,3],[4,5,6],'ro')


plt.subplot(223)
plt.xlim(xmax=7,xmin=0)
plt.ylim(ymax=7,ymin=0)
plt.xlabel("x")
plt.ylabel("y")
plt.plot([1,2,3],[4,5,6],'ro')

plt.show()

以上这篇python3实现绘制二维点图就是小编分享给大家的全部内容了,希望能给大家一个参考,也希望大家多多支持。
您可能感兴趣的文章:
加载全部内容