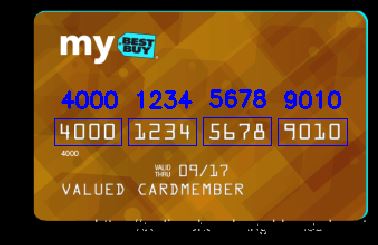
python opencv实现信用卡的数字识别
人气:0本项目利用python以及opencv实现信用卡的数字识别
前期准备
- 导入工具包
- 定义功能函数
模板图像处理
- 读取模板图像 cv2.imread(img)
- 灰度化处理 cv2.cvtColor(img,cv2.COLOR_BGR2GRAY)
- 二值化 cv2.threshold()
- 轮廓 - 轮廓
信用卡图像处理
- 读取信用卡图像 cv2.imread(img)
- 灰度化处理 cv2.cvtColor(img,cv2.COLOR_BGR2GRAY)
- 礼帽处理 cv2.morphologyEx(gray,cv2.MORPH_TOPHAT,rectKernel)
- Sobel边缘检测 cv2.Sobel(tophat, ddepth=cv2.CV_32F, dx=1, dy=0, ksize=-1)
- 闭操作 cv2.morphologyEx(gradX, cv2.MORPH_CLOSE, rectKernel)
- 计算轮廓 cv2.findContours
- 模板检测 cv2.matchTemplate(roi, digitROI,cv2.TM_CCOEFF)
原始数据展示


结果展示

1 前期准备
# 导入工具包
# opencv读取图片的格式为b g r
# matplotlib图片的格式为 r g b
import numpy as np
import cv2
from imutils import contours
import matplotlib.pyplot as plt
%matplotlib inline
# 信用卡的位置
predict_card = "images/credit_card_01.png"
# 模板的位置
template = "images/ocr_a_reference.png"
# 指定信用卡类型
FIRST_NUMBER = {
  "3": "American Express",
  "4": "Visa",
  "5": "MasterCard",
  "6": "Discover Card"
}
# 定义一些功能函数

# 对框进行排序
def sort_contours(cnts, method="left-to-right"):
  reverse = False
  i = 0

  if method == "right-to-left" or method == "bottom-to-top":
    reverse = True

  if method == "top-to-bottom" or method == "bottom-to-top":
    i = 1
  boundingBoxes = [cv2.boundingRect(c) for c in cnts] #用一个最小的矩形,把找到的形状包起来x,y,h,w
  (cnts, boundingBoxes) = zip(*sorted(zip(cnts, boundingBoxes),
                    key=lambda b: b[1][i], reverse=reverse))

  return cnts, boundingBoxes

# 调整图片尺寸大小
def resize(image, width=None, height=None, inter=cv2.INTER_AREA):
  dim = None
  (h, w) = image.shape[:2]
  if width is None and height is None:
    return image
  if width is None:
    r = height / float(h)
    dim = (int(w * r), height)
  else:
    r = width / float(w)
    dim = (width, int(h * r))
  resized = cv2.resize(image, dim, interpolation=inter)
  return resized

# 定义cv2展示函数
def cv_show(name,img):
  cv2.imshow(name,img)
  cv2.waitKey(0)
  cv2.destroyAllWindows()
2 对模板图像进行预处理操作
读取模板图像
# 读取模板图像
img = cv2.imread(template)
cv_show("img",img)
plt.imshow(img)
<matplotlib.image.AxesImage at 0x2b2e04ad128>
![[外链图片转存失败(img-bqUi8zm7-1565866397218)(output_11_1.jpg)]](https://img.qb5200.com/download-x/20210402/116118.jpg)
模板图像转灰度图像
# 转灰度图
ref = cv2.cvtColor(img,cv2.COLOR_BGR2GRAY)
cv_show("ref",ref)
plt.imshow(ref)
<matplotlib.image.AxesImage at 0x2b2e25d9e48>
![[外链图片转存失败(img-OfiXb5he-1565866397219)(output_13_1.jpg)]](https://img.qb5200.com/download-x/20210402/116119.jpg)
转为二值图像
ref = cv2.threshold(ref,10,255,cv2.THRESH_BINARY_INV)[1]
cv_show("ref",ref)
plt.imshow(ref)
<matplotlib.image.AxesImage at 0x2b2e2832a90>
![[外链图片转存失败(img-9ebIW8hU-1565866397220)(output_15_1.jpg)]](https://img.qb5200.com/download-x/20210402/116120.jpg)
计算轮廓
#cv2.findContours()函数接受的参数为二值图,即黑白的(不是灰度图),cv2.RETR_EXTERNAL只检测外轮廓,cv2.CHAIN_APPROX_SIMPLE只保留终点坐标
#返回的list中每个元素都是图像中的一个轮廓
# 在二值化后的图像中计算轮廓
refCnts,hierarchy = cv2.findContours(ref.copy(),cv2.RETR_EXTERNAL,cv2.CHAIN_APPROX_SIMPLE)
# 在原图上画出轮廓
cv2.drawContours(img,refCnts,-1,(0,0,255),3)
cv_show("img",img)
plt.imshow(img)
<matplotlib.image.AxesImage at 0x2b2e256f908>
![[外链图片转存失败(img-Dtk5KqNI-1565866397221)(output_17_1.jpg)]](https://img.qb5200.com/download-x/20210402/116121.jpg)
print(np.array(refCnts).shape)
# 排序,从左到右,从上到下
refCnts = sort_contours(refCnts,method="left-to-right")[0]
digits = {}

# 遍历每一个轮廓
for (i, c) in enumerate(refCnts):
  # 计算外接矩形并且resize成合适大小
  (x, y, w, h) = cv2.boundingRect(c)
  roi = ref[y:y + h, x:x + w]
  roi = cv2.resize(roi, (57, 88))

  # 每一个数字对应每一个模板
  digits[i] = roi
(10,)
3 对信用卡进行处理
初始化卷积核
rectKernel = cv2.getStructuringElement(cv2.MORPH_RECT, (9, 3))
sqKernel = cv2.getStructuringElement(cv2.MORPH_RECT, (5, 5))
读取信用卡
image = cv2.imread(predict_card)
cv_show("image",image)
plt.imshow(image)
<matplotlib.image.AxesImage at 0x2b2e294c9b0>
![[外链图片转存失败(img-WMVg6Luz-1565866397225)(output_23_1.jpg)]](https://img.qb5200.com/download-x/20210402/116122.jpg)
对图像进行预处理操作
# 先对图像进行resize操作
image = resize(image,width=300)
# 灰度化处理
gray = cv2.cvtColor(image,cv2.COLOR_BGR2GRAY)
cv_show("gray",gray)
plt.imshow(gray)
<matplotlib.image.AxesImage at 0x2b2e255d828>
![[外链图片转存失败(img-OLdT4boh-1565866397226)(output_25_1.jpg)]](https://img.qb5200.com/download-x/20210402/116123.jpg)
对图像礼帽操作
- 礼帽 = 原始输入-开运算结果
- 开运算:先腐蚀,再膨胀
- 突出更明亮的区域
tophat = cv2.morphologyEx(gray,cv2.MORPH_TOPHAT,rectKernel)
cv_show("tophat",tophat)
plt.imshow(tophat)
<matplotlib.image.AxesImage at 0x2b2eb008e48>
![[外链图片转存失败(img-0yzMkO55-1565866397227)(output_28_1.jpg)]](https://img.qb5200.com/download-x/20210402/116124.jpg)
用Sobel算子边缘检测
gradX = cv2.Sobel(tophat, ddepth=cv2.CV_32F, dx=1, dy=0, ksize=-1)
gradX = np.absolute(gradX)
(minVal, maxVal) = (np.min(gradX), np.max(gradX))
gradX = (255 * ((gradX - minVal) / (maxVal - minVal)))
gradX = gradX.astype("uint8")
print (np.array(gradX).shape)
cv_show("gradX",gradX)
plt.imshow(gradX)
(189, 300)
<matplotlib.image.AxesImage at 0x2b2e0797400>
![[外链图片转存失败(img-uoAHXkVD-1565866397232)(output_30_2.jpg)]](https://img.qb5200.com/download-x/20210402/116125.jpg)
对图像闭操作
- 闭操作:先膨胀,再腐蚀
- 可以将数字连在一起
gradX = cv2.morphologyEx(gradX, cv2.MORPH_CLOSE, rectKernel)
cv_show("gradX",gradX)
plt.imshow(gradX)
<matplotlib.image.AxesImage at 0x2b2e097cc88>
![[外链图片转存失败(img-WHOvOarz-1565866397234)(output_33_1.jpg)]](https://img.qb5200.com/download-x/20210402/116126.jpg)
#THRESH_OTSU会自动寻找合适的阈值,适合双峰,需把阈值参数设置为0
thresh = cv2.threshold(gradX, 0, 255,cv2.THRESH_BINARY | cv2.THRESH_OTSU)[1]
cv_show("thresh",thresh)
plt.imshow(thresh)
<matplotlib.image.AxesImage at 0x2b2e24a0dd8>
![[外链图片转存失败(img-rJfxoo8f-1565866397237)(output_34_1.jpg)]](https://img.qb5200.com/download-x/20210402/116127.jpg)
# 再进行一次闭操作
thresh = cv2.morphologyEx(thresh, cv2.MORPH_CLOSE, sqKernel) #再来一个闭操作
cv_show("thresh",thresh)
plt.imshow(thresh)
<matplotlib.image.AxesImage at 0x2b2e25fe748>
![[外链图片转存失败(img-DQjqCRvK-1565866397240)(output_35_1.jpg)]](https://img.qb5200.com/download-x/20210402/116128.jpg)
计算轮廓
threshCnts, hierarchy = cv2.findContours(thresh.copy(), cv2.RETR_EXTERNAL,cv2.CHAIN_APPROX_SIMPLE)
cnts = threshCnts
cur_img = image.copy()
cv2.drawContours(cur_img,cnts,-1,(0,0,255),3)
cv_show("img",cur_img)
plt.imshow(cur_img)
<matplotlib.image.AxesImage at 0x2b2eb17c780>
![[外链图片转存失败(img-B5JW2tVN-1565866397260)(output_37_1.jpg)]](https://img.qb5200.com/download-x/20210402/116129.jpg)
locs = []

# 遍历轮廓
for (i, c) in enumerate(cnts):
  # 计算矩形
  (x, y, w, h) = cv2.boundingRect(c)
  ar = w / float(h)

  # 选择合适的区域,根据实际任务来,这里的基本都是四个数字一组
  if ar > 2.5 and ar < 4.0:
    if (w > 40 and w < 55) and (h > 10 and h < 20):
      #符合的留下来
      locs.append((x, y, w, h))

# 将符合的轮廓从左到右排序
locs = sorted(locs, key=lambda x:x[0])
output = []
模板匹配
# 遍历每一个轮廓中的数字
for (i, (gX, gY, gW, gH)) in enumerate(locs):
  # initialize the list of group digits
  groupOutput = []

  # 根据坐标提取每一个组
  group = gray[gY - 5:gY + gH + 5, gX - 5:gX + gW + 5]
  cv_show("group",group)

  # 预处理
  group = cv2.threshold(group, 0, 255,cv2.THRESH_BINARY | cv2.THRESH_OTSU)[1]
  cv_show("group",group)

  # 计算每一组的轮廓
  digitCnts,hierarchy = cv2.findContours(group.copy(), cv2.RETR_EXTERNAL,cv2.CHAIN_APPROX_SIMPLE)
  digitCnts = contours.sort_contours(digitCnts,method="left-to-right")[0]

  # 计算每一组中的每一个数值
  for c in digitCnts:
    # 找到当前数值的轮廓,resize成合适的的大小
    (x, y, w, h) = cv2.boundingRect(c)
    roi = group[y:y + h, x:x + w]
    roi = cv2.resize(roi, (57, 88))
    cv_show("roi",roi)


    # 计算匹配得分
    scores = []
    # 在模板中计算每一个得分
    for (digit, digitROI) in digits.items():
      # 模板匹配
      result = cv2.matchTemplate(roi, digitROI,cv2.TM_CCOEFF)
      (_, score, _, _) = cv2.minMaxLoc(result)
      scores.append(score)

    # 得到最合适的数字
    groupOutput.append(str(np.argmax(scores)))

  # 画出来
  cv2.rectangle(image, (gX - 5, gY - 5),(gX + gW + 5, gY + gH + 5), (0, 0, 255), 1)
  cv2.putText(image, "".join(groupOutput), (gX, gY - 15),cv2.FONT_HERSHEY_SIMPLEX, 0.65, (0, 0, 255), 2)

  # 得到结果
  output.extend(groupOutput)
# 打印结果
print("Credit Card Type: {}".format(FIRST_NUMBER[output[0]]))
print("Credit Card #: {}".format("".join(output)))
cv_show("Image",image)
plt.imshow(image)
Credit Card Type: Visa
Credit Card #: 4000123456789010


<matplotlib.image.AxesImage at 0x2b2eb040748>
![[外链图片转存失败(img-EkSaLNgx-1565866397264)(output_41_2.jpg)]](https://img.qb5200.com/download-x/20210402/116130.jpg)
以上就是本文的全部内容,希望对大家的学习有所帮助,也希望大家多多支持。
您可能感兴趣的文章:
加载全部内容