python画图时设置分辨率和画布大小的实现(plt.figure())
白小斗 人气:3这篇文章主要介绍了python画图时设置分辨率和画布大小的实现(plt.figure()),文中通过示例代码介绍的非常详细,对大家的学习或者工作具有一定的参考学习价值,需要的朋友们下面随着小编来一起学习学习吧
本文介绍了python画图时设置分辨率和画布大小的实现,主要使用plt.figure(),下面就一起来了解一下
plt.figure()
示例:
import numpy as np
import pandas as pd
import warnings
warnings.filterwarnings('ignore')
import matplotlib.pyplot as plt
import seaborn as sns

#读取示例数据
df = pd.read_csv(  'https://labfile.oss.aliyuncs.com/courses/1283/telecom_churn.csv')
#sns.countplot(x='State', hue='Churn', data=df)

#画分布图
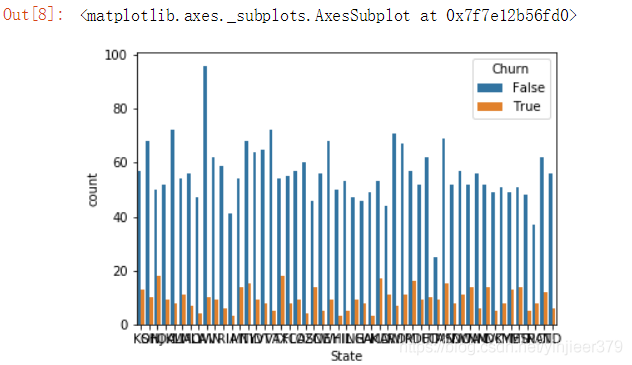
sns.countplot(x=df['State'], hue=df['Churn'])

调整后:
# 分辨率参数-dpi,画布大小参数-figsize
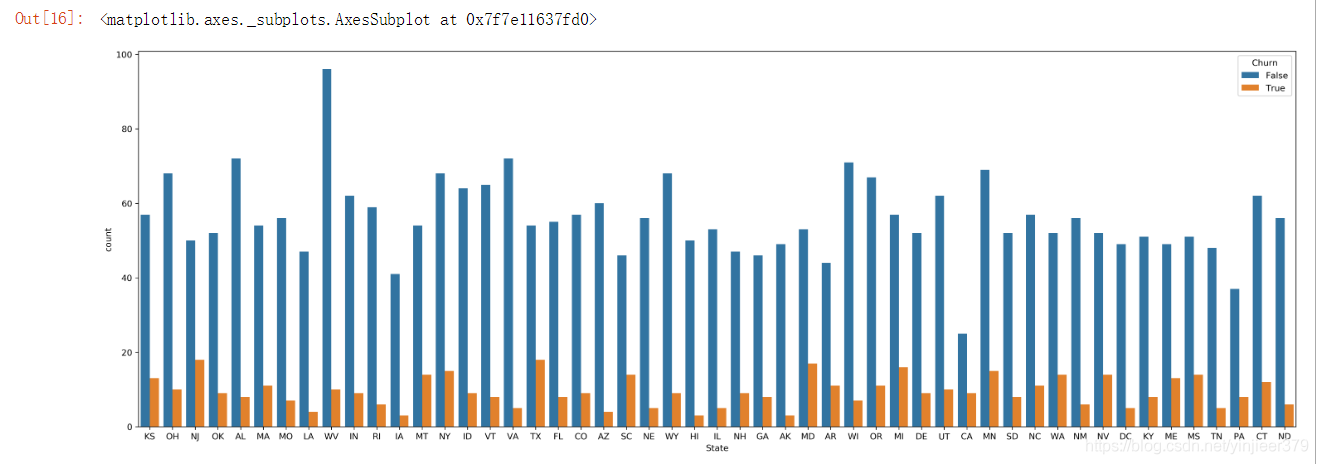
plt.figure(dpi=300,figsize=(24,8))
# 改变文字大小参数-fontsize
plt.xticks(fontsize=10)

#画分布图
sns.countplot(x=df['State'], hue=df['Churn'])

加载全部内容