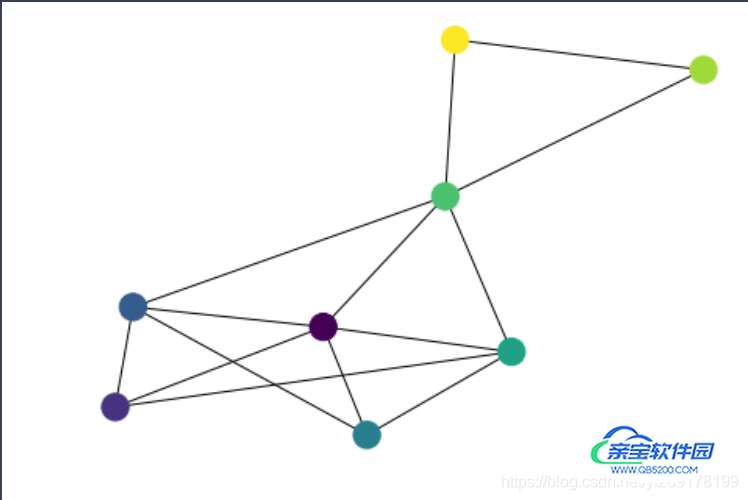
图邻接矩阵可视化解析
科技论文精讲 人气:0使用工具
#导入模块
import networkx as nx
import numpy as np
import matplotlib.pyplot as plt
import scipy.sparse as sp
准备数据
# 邻接矩阵
Matrix = np.array(
    [
        [0, 1, 1, 1, 1, 1, 0, 0],  # a
        [0, 0, 1, 0, 1, 0, 0, 0],  # b
        [0, 0, 0, 1, 0, 0, 0, 0],  # c
        [0, 0, 0, 0, 1, 0, 0, 0],  # d
        [0, 0, 0, 0, 0, 1, 0, 0],  # e
        [0, 0, 1, 0, 0, 0, 1, 1],  # f
        [0, 0, 0, 0, 0, 1, 0, 1],  # g
        [0, 0, 0, 0, 0, 1, 1, 0]  # h
    ]
)
转化临界矩阵
def get_matrix_triad(coo_matrix , data=False):
	'''
		获取矩阵的元组表示  (row,col)
		data 为 True 时 (row,col,data)
	:dependent  scipy
	:param coo_matrix: 三元组表示的稀疏矩阵  类型可以为 numpy.ndarray
	:param data: 是否需要 data值
	:return:
		list
	'''
	# 检查类型
	if not sp.isspmatrix_coo(coo_matrix):
		# 转化为三元组表示的稀疏矩阵
		coo_matrix = sp.coo_matrix(coo_matrix)
	# nx3的矩阵  列分别为 矩阵行,矩阵列及对应的矩阵值
	temp = np.vstack((coo_matrix.row , coo_matrix.col , coo_matrix.data)).transpose()
	return temp.tolist()
测试
edags = get_matrix_triad(Matrix)
-->
[[0.0, 0.0, 1.0],
 [0.0, 1.0, 1.0],
 [0.0, 2.0, 1.0],
 [0.0, 3.0, 1.0],
 [0.0, 4.0, 1.0],
 [0.0, 5.0, 1.0],
 [1.0, 1.0, 1.0],
 [1.0, 2.0, 1.0],
 [1.0, 4.0, 1.0],
 [2.0, 2.0, 1.0],
 [2.0, 3.0, 1.0],
 [3.0, 3.0, 1.0],
 [3.0, 4.0, 1.0],
 [4.0, 4.0, 1.0],
 [4.0, 5.0, 1.0],
 [5.0, 2.0, 1.0],
 [5.0, 5.0, 1.0],
 [5.0, 6.0, 1.0],
 [5.0, 7.0, 1.0],
 [6.0, 5.0, 1.0],
 [6.0, 6.0, 1.0],
 [6.0, 7.0, 1.0],
 [7.0, 5.0, 1.0],
 [7.0, 6.0, 1.0],
 [7.0, 7.0, 1.0]]
创建图
# 创建一个没有边,没有节点的空图Graph
G = nx.Graph()
添加节点
按照节点的个数添加节点
H = nx.path_graph(Matrix.shape[0])
G.add_nodes_from(H)
添加边
G.add_edges_from(edags) #添加边
# 若数据含有权重,及 get_matrix_triad() 中 data = True ,则使用
G.add_weighted_edges_from(edags)
绘图
colors = np.arange(Matrix.shape[0])
nx.draw(G,pos=nx.spring_layout(G),node_color=colors)
plt.show()

扩展
美化图
合理使用**draw_networkx ()**中的参数,来美化图
draw_networkx()
总结
以上为个人经验,希望能给大家一个参考,也希望大家多多支持。
加载全部内容