vue封装echarts组件,数据动态渲染方式
蓝胖子的多啦A梦 人气:0vue封装echarts组件,数据动态渲染
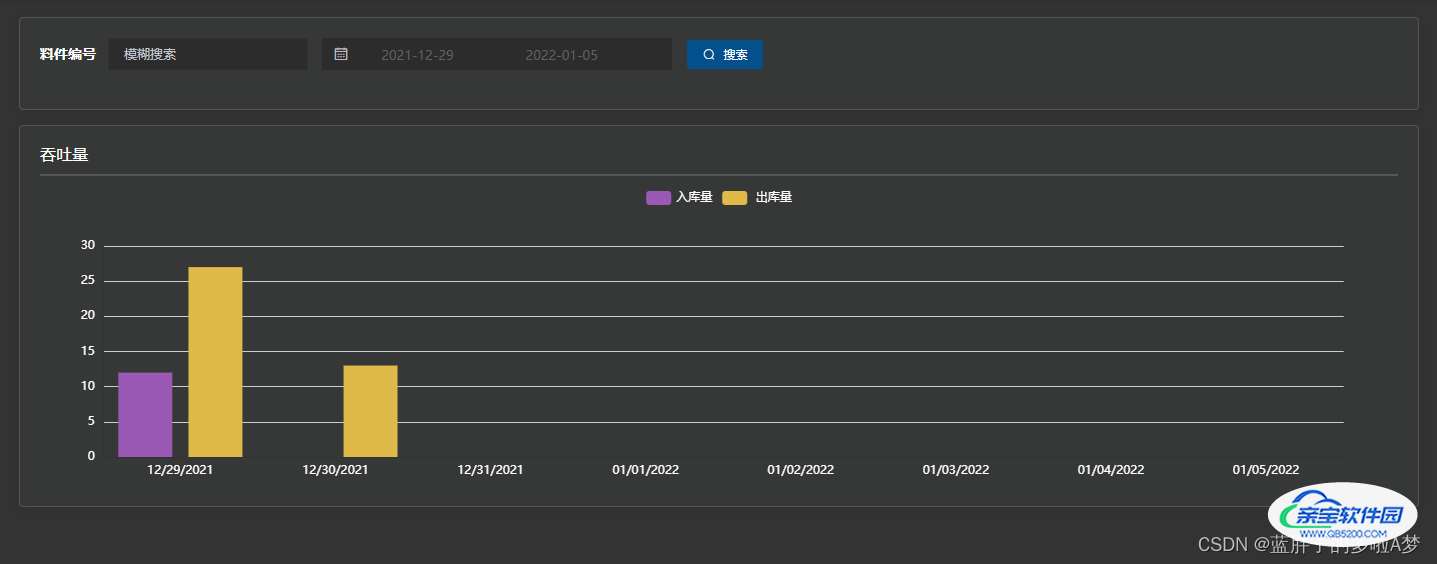
需求:显示默认时间为当前时间至7天之前时间 去请求数据
实现效果:

1.安装Echarts
cnpm install echarts -S
2.在vue项目中使用Echarts

父组件使用子组件的代码
template区的使用
     <BarChart
        :labelList="chartData.labelList"
        :checkOutValueList="chartData.checkOutValueList"
        :putInValueList="chartData.putInValueList"
      />
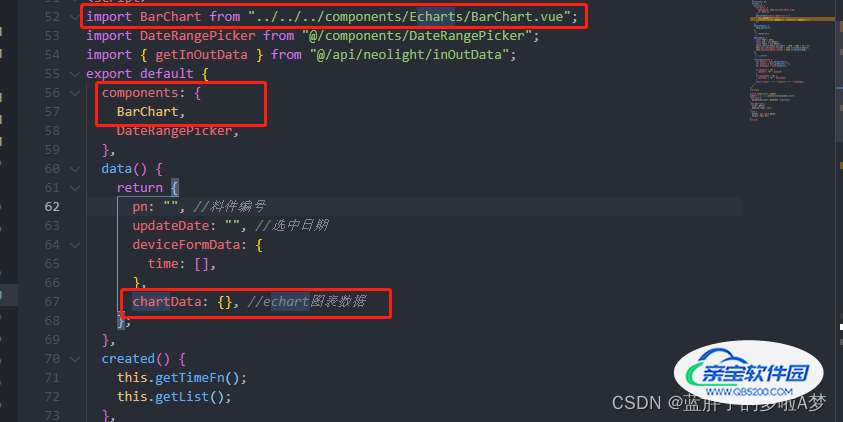
数据 (引入组件,注册组件,定义图表需要的数据)

 data() {
    return {
     chartData: {}, //echart图表数据
    };
  },
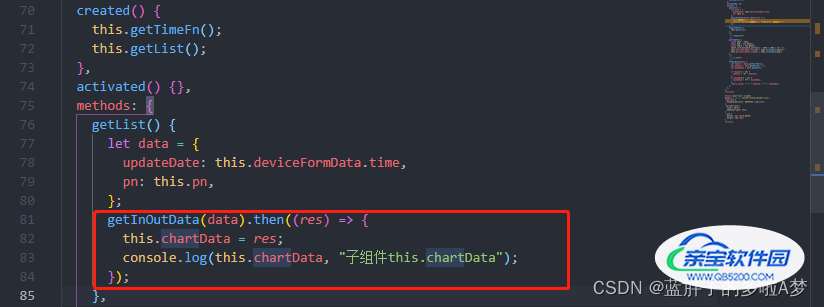
接口返回数据

  created() {
    this.getList();
  },
  methods: {
    getList() {
      let data = {
        updateDate: this.deviceFormData.time,
        pn: this.pn,
      };
      getInOutData(data).then((res) => {
        this.chartData = res;
        console.log(this.chartData, "子组件this.chartData");
      });
    },
  }
数据结构:

子组件页面代码(接收数据,并渲染)
<template>
  <div
    :class="className"
    :style="{ height: height, width: width }"
    id="myChart"
  />
</template>
<script>
import echarts from "echarts";
export default {
  props: {
    //接受父组件传递来的数据
    labelList: Array,
    checkOutValueList: Array,
    putInValueList: Array,
    className: {
      type: String,
      default: "chart",
    },
    width: {
      type: String,
      default: "100%",
    },
    height: {
      type: String,
      default: "300px",
    },
  },
  data() {
    return {};
  },
  watch: {
    labelList: function (newQuestion, oldQuestion) {
      this.initChart();
    },
  },
  mounted() {
    this.initChart();
  },
  methods: {
    initChart() {
      // 创建 echarts 实例。
      var myChartOne = echarts.init(document.getElementById("myChart"));
      myChartOne.setOption({
        tooltip: {
          trigger: "axis",
          axisPointer: {
            type: "shadow",
          },
        },
        legend: {
          textStyle: {
            color: "#ffffff",
          },
        },
        grid: {
          left: "3%",
          right: "4%",
          bottom: "3%",
          containLabel: true,
        },
        xAxis: [
          {
            type: "category",
            data: this.labelList,
            axisTick: {
              alignWithLabel: true,
            },
            axisLabel: {
              textStyle: {
                color: "#fff", //坐标值得具体的颜色
              },
            },
          },
        ],
        yAxis: [
          {
            type: "value",
            axisLabel: {
              textStyle: {
                color: "#fff", //坐标值得具体的颜色
              },
            },
          },
        ],
        series: [
          {
            name: window.vm.$i18n.t("barChart.putQuantity"),
            type: "bar",
            data: this.checkOutValueList,
            itemStyle: {
              color: "#9B59B6",
            },
          },
          {
            name: window.vm.$i18n.t("barChart.outQuantity"),
            type: "bar",
            data: this.putInValueList,
            itemStyle: {
              color: "#DFBA49",
            },
          },
        ],
      });
    },
  },
};
</script>
vue动态渲染echarts图表
最近做项目遇到这样一个场景,有一个标签选择界面,选择不同的标签需要展示不同的图表有可能折线图,有可能柱状图,也可能饼图,图表的类型由后端返回,标签可以多选。这个时候就需要动态来渲染不定数量和类型的echarts图表了。
第一步,选择标签
将选择的所有标签存储到downloadCheckList数组中,再添加一个数组editableTabs用来存放需要展示的标签的相关信息。obj1代表发送请求时需要携带的参数,obj也需要携带,处理数据会用到。同时初始化echarts图表。
//选择标签完成
     selecttrue(val) {
    	let that=this
    	// 每次选择标签完成创建echarts实例,
    	 if(val==2){
	    	//遍历整理信息
			 for (let i in that.downloadCheckList) {
		       let obj = {
		          title: that.downloadCheckList[i],//图表名字
		          id: "chart" + i, //图表id
		          chart: null, //用来存储图表实例
		          name: i,     //每个图表对应的顺序
		        };
		        let obj1={
		          timeScope:"$timeScope"
		        }
		        obj1[that.downloadCheckList[i]]=`$${that.downloadCheckList[i]}`
		        that.editableTabs.push(obj);
		        //发送ajax请求
		        that.getDataFromLabel(obj1,that.Time[0], that.Time[1],obj);
		      }
		      	//分配初始化图表
		        that.chartInit();
	        }else{
	           // 切换时间不需要执行chartInit()创建echarts实例
		       for (let i in that.editableTabs) {
		          let obj = that.editableTabs[i]
		          let obj1={
		            timeScope:"$timeScope"
		          }
		          obj1[that.editableTabs[i].title]=`$${that.editableTabs[i].title}`
		          that.getDataFromLabel(obj1, that.Time[0], that.Time[1],obj);
		        }
	        }
     }

    // 分配初始化图表
	  chartInit() {
	      let that = this;
	      this.$nextTick(() => {
	      //动态获取宽高
	        let WH=document.getElementById('WH').childNodes[0]
	        for (let i in that.editableTabs) {
	          that.editableTabs[i].chart = that.$echarts.init(document.getElementById(that.editableTabs[i].id));
	        }
	        that.width =parseInt(window.getComputedStyle(WH,null).width)-14+'px'
	        that.height =parseInt(window.getComputedStyle(WH,null).height)-10+'px'
	      });
	    },
HTML部分使用v-for 遍历 editableTabs数组代表需要展示的图表。这里使用动态宽高来适应不同屏幕尺寸。
      <div v-for="item in editableTabs" id='WH' :key="item.id">
        <div :style="{width:width,height:height}" :id="item.id" :ref="item.id">{{item.title}}</div>
        </div>
      </div>
第二步 处理服务端返回的数据
请求完成后执行 setdatalabel() 方法处理数据,data为服务端返回的数据,obj为请求时携带的标签信息,
    setdatalabel(data,obj) {
        let that=this
        //新建dataobj存储总数据,dataArr用来存储echarts的series属性的数据,处理完成的数据放在这里即可
        let dataobj={
          sort:obj.name,  //当前标签在数组editableTabs中的位置
          shapeType:"",  //存储当前标签需要展示的图表类型(bar line pie )
          title:obj.title,  //当前标签名称(echarts的title)
          dataArr:[]   //存放处理完成的series数据
        }
   		//将data包含的图表类型赋给dataobj.shapeType
        // 分辨展示类型
        // 根据不同的图表类型执行不同的的处理方法
        if(dataobj.shapeType=="pie"){
          that.setPieData(dataobj,data)
        }else if(dataobj.shapeType=="line"){
          that.setLineDate(dataobj,data)
        }
    },
第三步 创建图表数据
数据处理完成之后,将携带数据的dataobj传递给渲染图表的方法,(这里折线图和柱状图可以使用同一个方法,处理数据时动态修改type即可)
   setLineDate(dataobj,data){
   		//处理数据的逻辑
   		//........
   		//.........
   		//处理完成之后创建图表
   		this.createlinechart(dataobj)
	}

   createlinechart(dataobj) {
      let that = this;
      let option = (option = {
        title: {
          text: dataobj.title,
          textStyle: {
            fontSize: 14,
            color: "#626262",
          },
        },
        tooltip: {
          trigger: "axis",
          axisPointer: {
            type: "",
          },
          backgroundColor: "white",
          extraCssText: "box-shadow: 0 0 3px rgba(0, 0, 0, 0.3);",
          borderColor: "#ECECEC",
          textStyle: {
            //字体样式
            color: "#979797",
            align: "left",
          },
          confine: true,
        },
        legend: {
          icon: dataobj.shapeType=='bar'?'':'circle',
          x: "right",
          y: "0%",
        },
        grid: {
          left: "3%",
          right: "4%",
          bottom: "3%",
          containLabel: true,
        },
        xAxis: [
          {
            type: "category",
            data: this.chartXisArr,   //x轴数据
            axisPointer: {
              type: "",
            },
            axisLabel: {
              color: "#E1E1E1",
            },
            axisTick: {
              show: false,
            },
            axisLine: {
              lineStyle: {
                color: "#E1E1E1",
              },
            },
          },
        ],
        yAxis: [
          {
            type: "value",
            show: true,
            axisLabel: {
              formatter: "{value} /人次",
              color: "#E1E1E1",
            },
            axisTick: {
              //y轴刻度线
              show: false,
            },
            axisLine: {
              //y轴
              show: false,
            },
          },
        ],
        series: dataobj.dataArr,
      });
      this.$nextTick(()=>{
      	//对对应标签的echarts实例执行setOption()
        this.editableTabs[Number(dataobj.sort)].chart.setOption(option, true);
        //由于设置了动态宽高,所以需要resize()
        this.editableTabs[Number(dataobj.sort)].chart.resize()
      })
    },
如果是饼图则执行饼图的处理数据方法并 setOption() 即可,同理如果需要其他图表类型,则继续添加对应处理方法即可。
最后附上效果图,(新手一枚,如有错误还请指正!)

以上为个人经验,希望能给大家一个参考,也希望大家多多支持。
加载全部内容