Vue使用Echarts实现排行榜效果
浩铖 人气:0Vue使用 Echarts 做出排行榜的感觉,供大家参考,具体内容如下
其实这不算是一篇技术文的,就是单纯的echarts调样式就可以,但是有的地方设置还是不好设置的,所以说嘞,就保存一下吧,以后自己用到了的话课可以直接拿来修修改改就可以二次利用了。
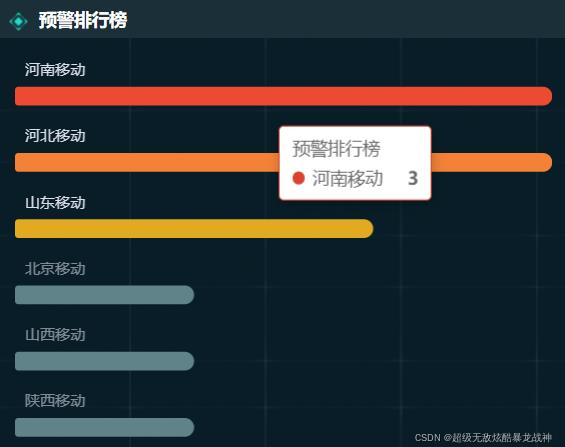
做出来的效果就是这个样子:

这个排行榜一共就展示前六,就是这个样子,然后把这个echarts搞成了一个组件,在需要的地方引用就可以了。
下面直接上代码:
<doc>
  柱形图-排行榜
</doc>
<template>
  <div id="bar" style="width: 100%;height:100%;"></div>
</template>
<script>
  import * as echarts from 'echarts'
  export default {
    data() {
      return {
        xValue: [1,1,1,2,3,3],
        yValue: ['陕西移动', '山西移动', '北京移动', '山东移动', '河北移动', '河南移动'],
      };
    },
    mounted() {
      this.show()
    },
    methods: {
      show() {
        this.charts = echarts.init(document.getElementById('bar'))
        var option = {
          color: ['#d84430'],
          tooltip: {
            show: true
          },
          yAxis: {
            axisTick: {
              show: false
            },
            axisLine: {
              show: false,
            },
            axisLabel: {
              inside: true,
              verticalAlign: 'bottom',
              lineHeight: 40,
              color: '#DDDFEB',
              formatter: function (value, index) {   // 设置y轴文字的颜色
                if (index > 2) {
                  return '{first|' + value + '}'
                } else {
                  return '{other|' + value + '}'
                }
              },
              rich: {
                other: {
                  color: '#DDDFEB',
                  opacity: 0.57
                },
                first: {
                  color: '#DDDFEB'
                }
              }
            },
            data: this.yValue
          },
          xAxis: {
            nameTextStyle: {
              color: 'rgba(255, 255, 255, 0.8)',
              align: 'right'
            },
            splitLine: {
              show: false,
            },
            axisLine: {
              show: false,
            },
            axisLabel: {
              color: 'rgba(255, 255, 255, 0.8)'
            },
          },
          grid: {
            top: '0%',
            bottom: '0%',
            left: '0%',
            right: '0%'
          },
          series: [{
            name: '预警排行榜',
            barWidth: 15,
            type: 'bar',
            data: this.xValue,
            itemStyle: {
              normal: {
                borderRadius: [3, 20, 20, 3],
                color: function (params) {   // 设置柱形图的颜色
                  if (params.dataIndex === 5) {
                    return '#d84430'
                  } else if (params.dataIndex === 4) {
                    return '#f38237'
                  } else if (params.dataIndex === 3) {
                    return '#e2aa20'
                  } else {
                    return '#608289'
                  }
                }
              },
            }
          }]
        };
        // 使用刚指定的配置项和数据显示图表。
        this.charts.setOption(option);
        window.addEventListener('resize', () => {
          this.charts.resize()
        })
      }
    }
  }
</script>
<style scoped>

</style>
就是这个样子,如果有特别的样式可以稍微改一下。
加载全部内容