通过filebeat、logstash、rsyslog采集nginx日志的几种方式
xiejava 人气:0
由于nginx功能强大,性能突出,越来越多的web应用采用nginx作为http和反向代理的web服务器。而nginx的访问日志不管是做用户行为分析还是安全分析都是非常重要的数据源之一。如何有效便捷的采集nginx的日志进行有效的分析成为大家关注的问题。本文通过几个实例来介绍如何通过filebeat、logstash、rsyslog采集nginx的访问日志和错误日志。
大家都知道ELK技术栈是采集、分析日志的利器。所以这里介绍的是从nginx采集日志到ES。当然至于日志采集以后存到看大家的需要。通过logstash可以方便的配置日志输出存储的方式。
一般来说nginx默认安装后,日志文件在 /usr/local/nginx/logs 目录下。分别有 access.log和error.log 访问日志和错误日志。
这次示例Elasitcsearch是三个节点组成的集群172.28.65.22、172.28.65.23、172.28.65.24,172.28.65.30 是kibana的地址,172.28.65.32是数据采集服务器,上面装有logstash、nginx、 filebeat。一般来说采集服务器上有logstash,而nginx、 filebeat应该是装在采集目标上。
## 一、直接通过filebeat采集日志到ES
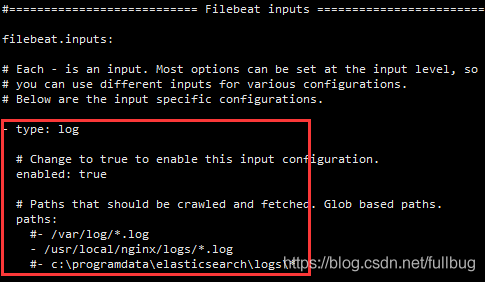
在filebeat的安装目录找到filebeat.yml 配置获取日志文件的路径及输出到ES的配置。
具体:
```powershell
- type: log
# Change to true to enable this input configuration.
enabled: true
# Paths that should be crawled and fetched. Glob based paths.
paths:
#- /var/log/*.log
- /usr/local/nginx/logs/*.log
#- c:\programdata\elasticsearch\logs\*
```
如果需要在kibana中友好显示的化,可进行kibana配置

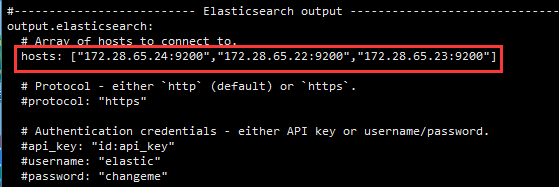
输出到es中,在hosts中配置好你的ES服务地址。如果单机只有一个节点,就可以只配一个ip和端口。
启动filebeat 进行日志数据采集
```powershell
./filebeat -e -c filebeat.yml -d "publish"
```
通过elasticsearch-head插件查看es索引中的日志信息
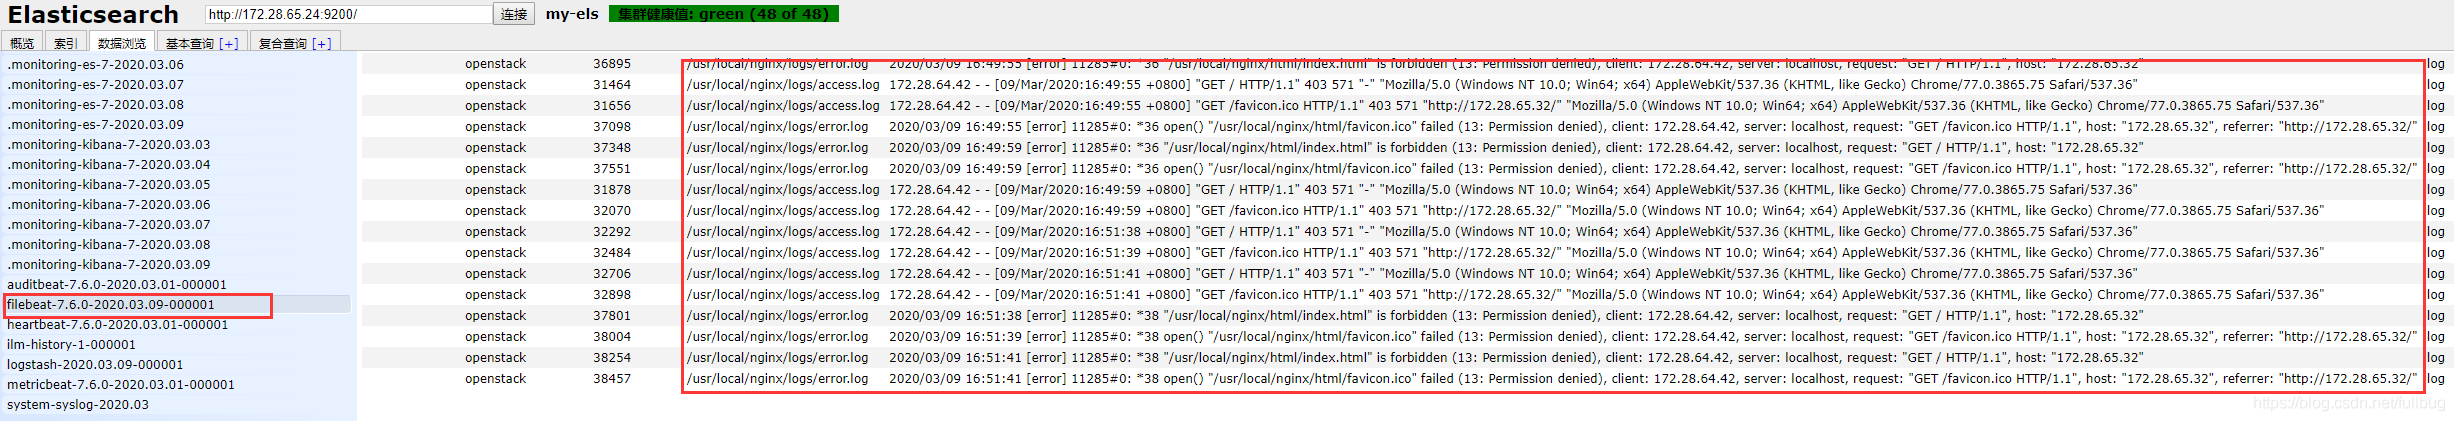
可以看到nginx中的access.log和error.log的日志都已经上来了。
在kibana中通过filebeat-*过滤看filebeat的索引,可以看到通过filebeat采过来的数据。
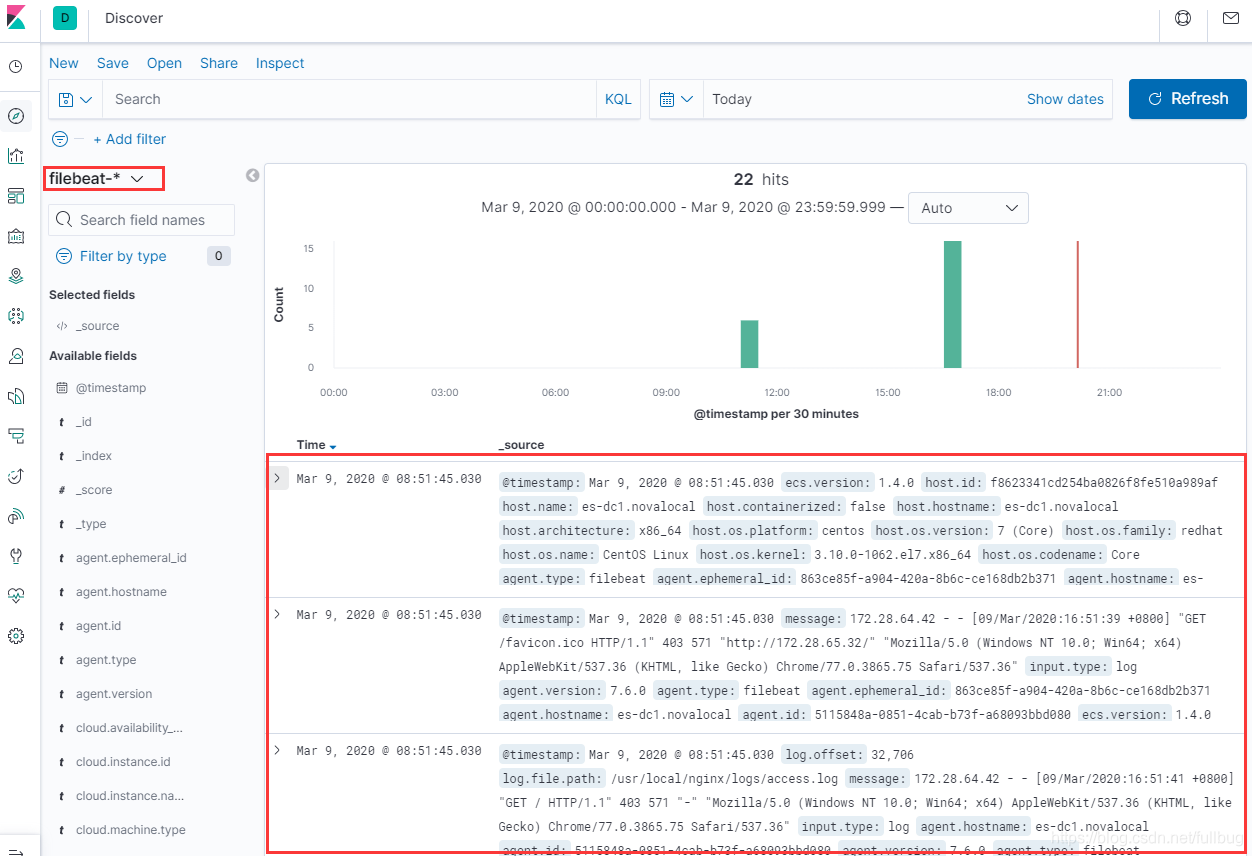
这种直接通过filebeat直接对接ES采日志的方式简单直接,但是无法对采集的日志进行预处理和其他一些操作,也不够灵活。
可以在filebeat 和 ES之间加一层Logstash,可以将filebeat于ES解耦,通过Logstash可以做一些预处理,也可以通过Logstash采集到除ES以外的其他数据存储上。
## 二、通过filebeat采集日志到logstash再送到ES

首先得安装 logstash ,安装完后在logstash的安装目录下新建vi filebeat-pipeline.conf
filebeat-pipeline.conf的具体配置如下:
```powershell
input {
beats {
port => "5044"
}
}
output {
elasticsearch { hosts => ["172.28.65.24:9200"] }
stdout { codec => rubydebug}
}
```
input配置表示通过5044端口接收beats的数据
output配置表示输出到elasticsearch,并且同时输出到标准输出也就是控制台。
然后通过命令
```powershell
bin/logstash -f filebeat-pipeline.conf --config.reload.automatic
```
应用filebeat-pipeline.conf启动logstash。
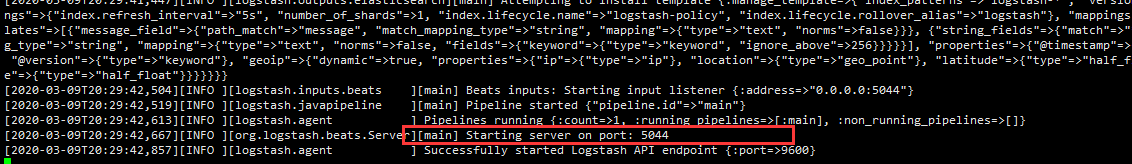
启动以后可以看到logstash的启动日志5044端口的服务已经起了,可以接受通过filebeat通过5044端口传过来的数据了。
接下来配置filebeat
在filebeat的安装目录找到filebeat.yml 配置获取日志文件的路径及输出到logstash的配置。不直接输出到ES了。
具体配置如下:
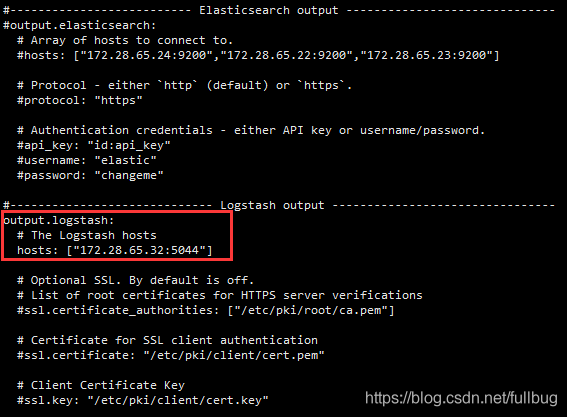
将output.elasticsearch的配置屏蔽
配置output.logstash,配置正确的logstash的服务主机和端口
启动filebeat 进行日志数据采集
```powershell
./filebeat -e -c filebeat.yml -d "publish"
```
我们访问nginx服务提供的web服务http://172.28.65.32/
在logstash的控制台 可以看到相应的访问access.log 日志

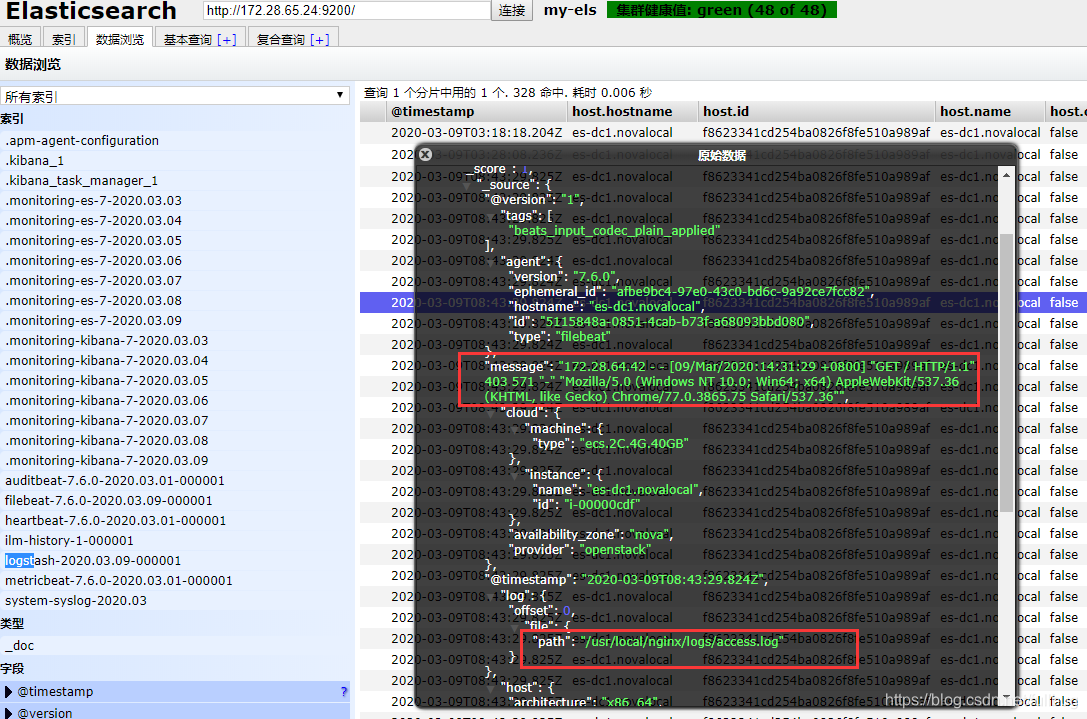
同时在ES 中也可以看到有相应的日志数据
## 三、直接通过rsyslog采集日志到logstash在送到ES
在很多情况下你需要采集的web服务器并不是自己能够控制的,不是说你想装filebeat就可以让你装的,这时候就可以要求目标数据源通过 syslog 的方式将日志发出来。我们可以再通过 logstash送到ES或其他的日志存储处理平台。

通过syslog往日志服务器上发nginx的日志有两种方式,一种就是利用nginx的配置往外发日志,一种就是通过配置linux的rsyslog的配置往外发日志。
**1、通过nginx配置发送syslog到logstash**
参考见nginx官方文档:[http://nginx.org/enhttps://img.qb5200.com/download-x/docs/syslog.html](http://nginx.org/enhttps://img.qb5200.com/download-x/docs/syslog.html)
具体配置如下:
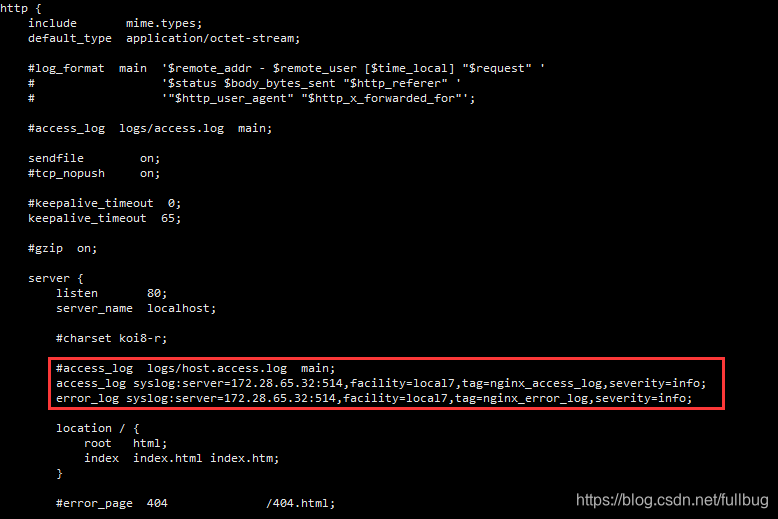
在nginx的配置文件nginx.conf中
在server下配置access_log和error_log的输出方式
```powershell
access_log syslog:server=172.28.65.32:514,facility=local7,tag=nginx_access_log,severity=info;
error_log syslog:server=172.28.65.32:514,facility=local7,tag=nginx_error_log,severity=info;
```
配置完成后执行 `./nginx -s reload` 使配置生效。这样就通过linux的rsyslog服务将nginx的日志往外发了。
接着来配置logstash的syslog的服务接收配置 。在logstash的安装目录下新建`vi syslog-pipeline.conf`
syslog-pipeline.conf的具体配置如下:
```powershell
input {
syslog{
type => "system-syslog"
port => 514
}
}
output {
elasticsearch {
hosts => ["172.28.65.24:9200"]
index => "system-syslog-%{+YYYY.MM}"
}
stdout { codec => rubydebug}
}
```
input配置表示通过514端口接收syslog的数据
output配置表示输出到elasticsearch,并且同时输出到标准输出也就是控制台。
通过执行 `bin/logstash -f syslog-pipeline.conf --config.reload.automatic` 启动logstash

可以看到logstash启动以后开启了514端口的tcp和upd协议的侦听。
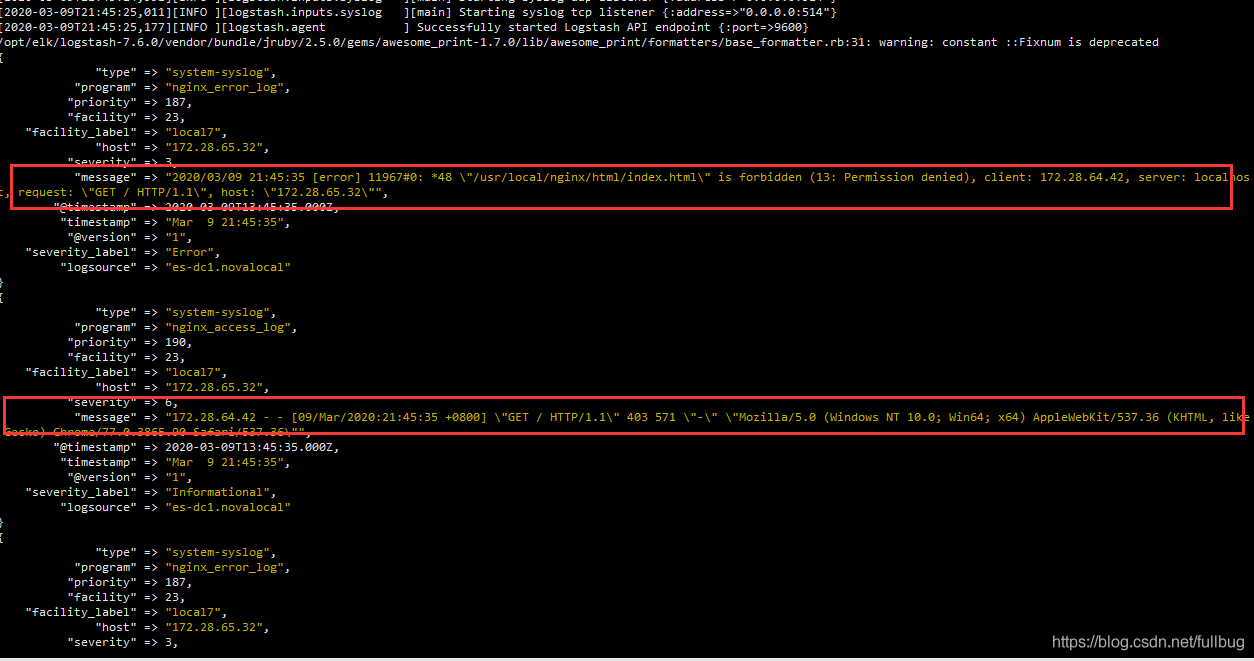
我们访问nginx服务提供的web服务http://172.28.65.32/
在logstash的控制台 可以看到相应的nginx访问access和error的日志

同样通过Elasticsearch-head在ES 中也可以看到有相应的日志数据

**2、通过配置rsyslog发送syslog日志到logstash**
有些老版本的nginx不支持配置syslog输出日志,或者说我想输出其他不是nginx的日志该怎么办呢?可以通过直接配置rsyslog的方式来往外发送日志。
在/etc/rsyslog.conf 中配置
```powershell
$IncludeConfig /etc/rsyslog.d/*.conf
```
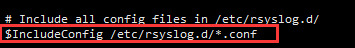
意思是可以引用外部的配置文件,引用外部的配置文件一方面可以不影响主配置文件,另一方面也比较好管理
在/etc/rsyslog.d目录下新建nginx-log.conf
配置如下:
```powershell
$ModLoad imfile
$InputFilePollInterval 1
$WorkDirectory /var/spool/rsyslog
$PrivDropToGroup adm
##Nginx访问日志文件路径,根据实际情况修改:
$InputFileName /usr/local/nginx/logs/access.log
$InputFileTag nginx-access:
$InputFileStateFile stat-nginx-access
$InputFileSeverity info
$InputFilePersistStateInterval 25000
$InputRunFileMonitor
##Nginx错误日志文件路径,根据实际情况修改:
$InputFileName /usr/local/nginx/logs/error.log
$InputFileTag nginx-error:
$InputFileStateFile stat-nginx-error
$InputFileSeverity error
$InputFilePersistStateInterval 25000
$InputRunFileMonitor
*.* @172.28.65:514
```
配置好了以后,重启rsyslog服务
```powershell
systemctl restart rsyslog
```
我们访问nginx服务提供的web服务http://172.28.65.32/
在logstash的控制台 可以看到同样的效果。
本文介绍了如何通过filebeat、logstash、rsyslog采集nginx的访问日志和错误日志的几种方式,具体需要根据实际情况灵活的运用。
-------------------
作者博客:[http://xiejava.gitee.io](http://xiejava.gitee.io)
加载全部内容