Mysql自带profiling性能分析工具使用分享
人气:0Mysql自带profiling性能分析工具使用分享,需要的朋友可以参考下
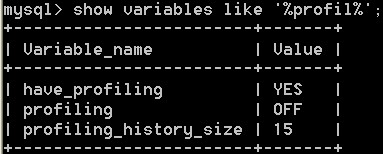
1. show variables like '%profiling%';(查看profiling信息)
2. set profiling=1;(开启profiling)

3. 执行SQL查询
例:select goods_name from ecs_goods where goods_id <5000;
show profiles;

4. show profile for query 4;

show profile 的格式如下:
SHOW PROFILE [type [, type] ... ]
[FOR QUERY n]
[LIMIT row_count [OFFSET offset]]
type:
ALL
| BLOCK IO
| CONTEXT SWITCHES
| CPU
| IPC
| MEMORY
| PAGE FAULTS
| SOURCE
| SWAPS
加载全部内容